TABLE OF CONTENTS:
The easiest way to start profitable trading in the market is to analyze performance of successful traders. MyFxBook (link) is the largest account monitoring system, where thousands of Forex accounts and strategies are analyzed every day. (MyFxBook compatible with any Forex Broker). It makes it almost an ideal “source of inspiration”. Profit chart cannot alone give you the complete information about how a trading strategy operates. The important benefit of the monitoring system is that it provides access to a trading history of many accounts. If the history of trades is available to you, you can try to reconstruct the initial forex strategy behind these trades.
Of course, the simplest way to do it is to implement it directly on the MT4 chart of your trading terminal. However, copying one trade into your chart at a time would be inefficiently. In this case an automatic script and instruction can be of help to you.
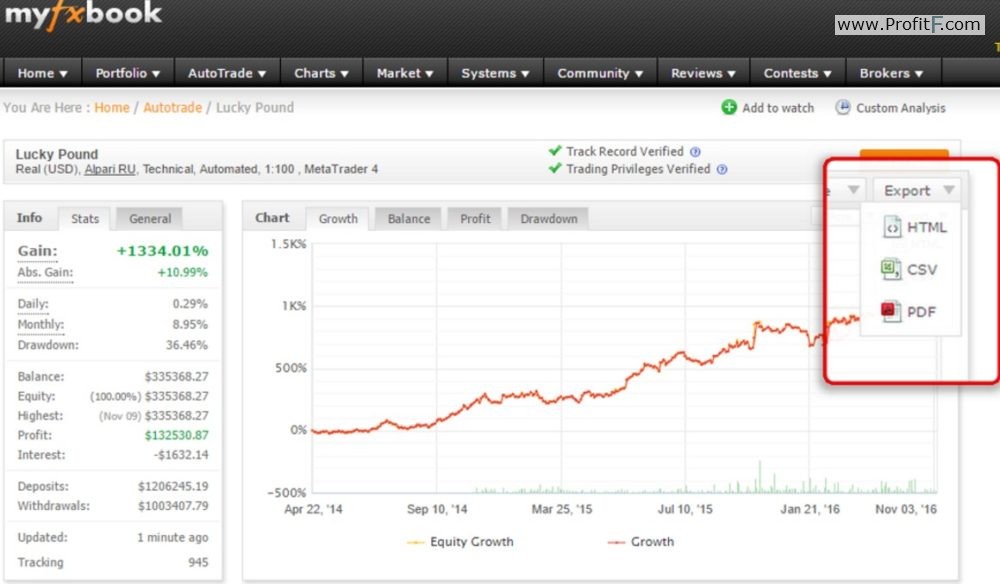
Firstly, let’s go to the web-page, where an account of interest is monitored. Click “Export” – “CSV” in the upper right hand corner of the profit chart to download the “statement.csv” file, which contains a history of all trades. Our current task is to display all trades from the current list on the chart of our trading platform
Run Metatrader 4 and click “File” – “Open Data Folder”.
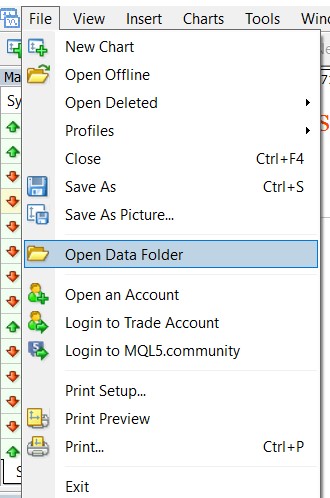
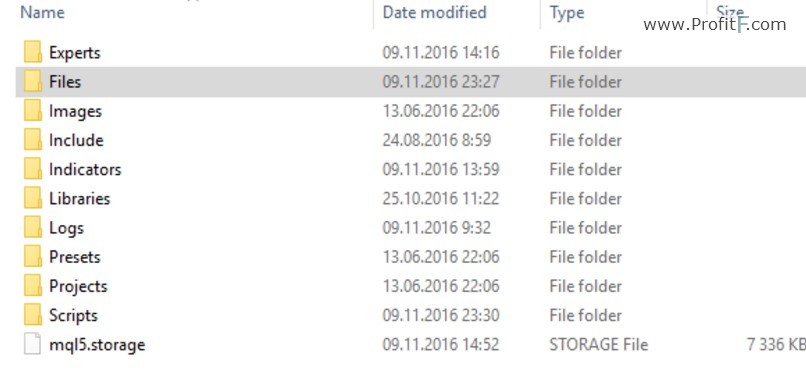
It will open the folder where terminal data are stored. Place the “statement.csv” file into the “MQL4” – “Files” folder. You can change the file name as you wish.
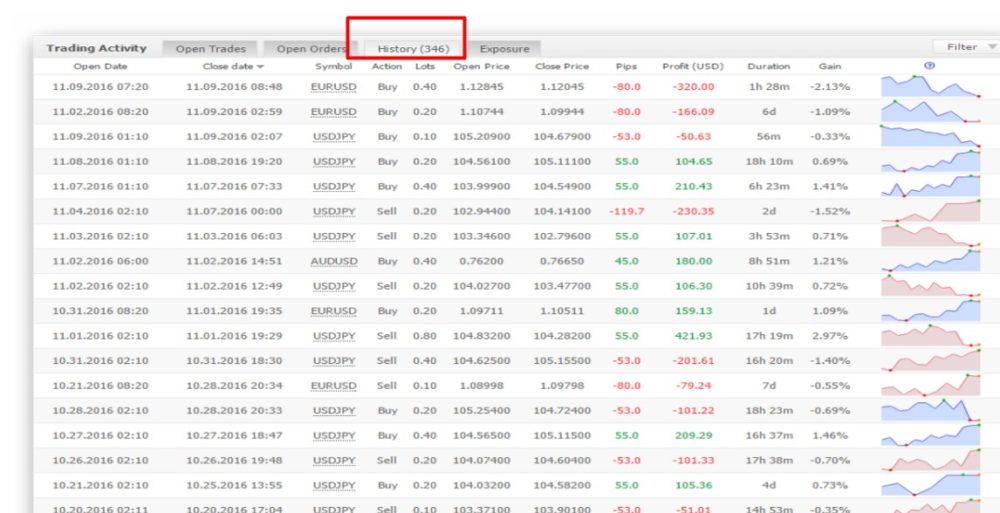
Now open a chart of the symbol of interest. As a rule, you should take interest in the symbol having the largest number of trades. You can learn what kind of symbols are the most actively traded by opening the “History” tab on the MyFxBook website.
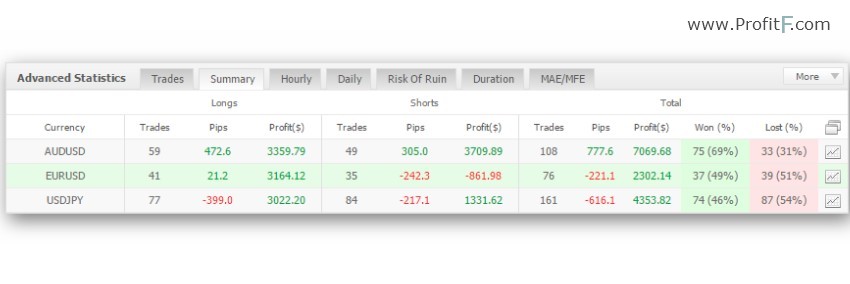
You can also do it by viewing the summary of advanced statistics (the “Trades” tab displays the total number of trades for any symbol):
Next you need the special script. Download it here >> (see here how install script into MT4) It’s free ex4 file, Contact with us if you want to buy MQ4 version
After opening the required symbol you need to run the script, enter a name of the history file (in case you have changed its name) and a time shift (it is required to adjust a time zone of your trading terminal allowing for a time zone of quotation provider), if necessary.
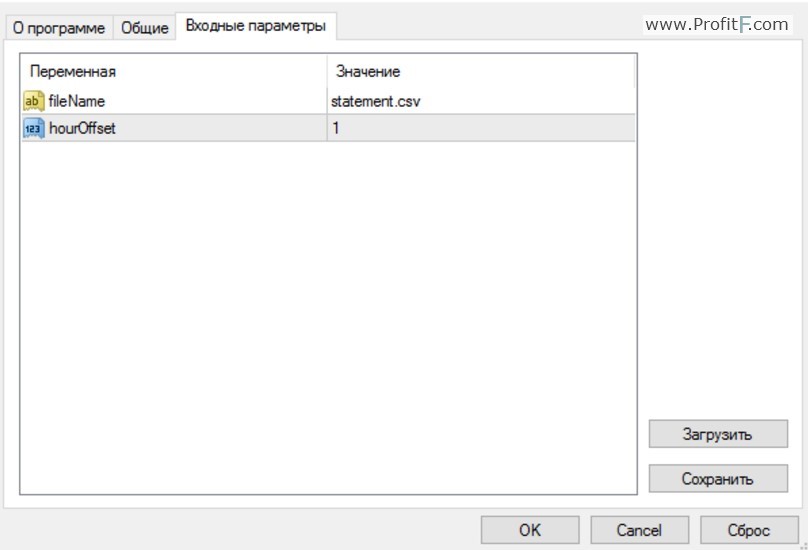
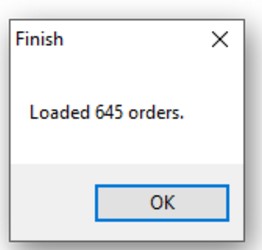
The data window showing a number of copied trades will appear during the process.
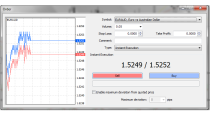
Now all the trades are displayed on the chart as if you have simply moved them directly from your terminal’s history file. If you place the mouse cursor over a trade, you will see its sequence number and lot size.
You can easily determine what type of trading strategy – trend-following, channel trading, grid averaging or martingale – a history of trades being analyzed refers to, if you make use of the trading history. At this stage you can throw away all the strategies unworthy of more detailed study or not demonstrating signs of systematic trading.
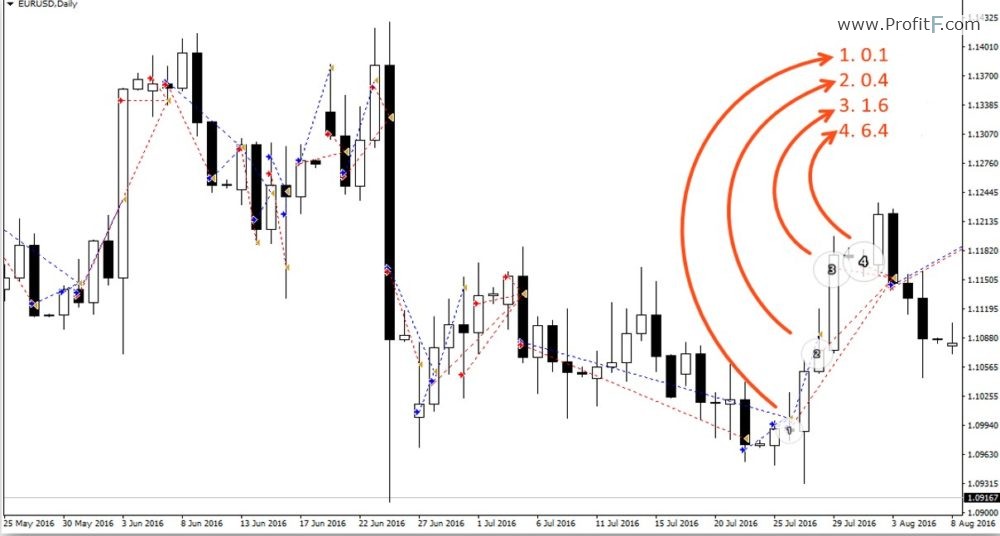
Well, let’s try to analyze the first account we see, which has a nice profit chart.
Load trades from the history file on the chart. At first glance one can realize that it is not a typical grid-based strategy, since the periodicity of its trades significantly varies both in time and price. It seems that the trades are opened based on signals generated by some indicator. The fact of applying 4-fold increment to the lot size makes me cautious. The lot size is increased from 0.1 to 6.4, i.e. is multiplied by exactly 64 times, to make a series of trades and make a profit. Therefore, the strategy is based on waiting for positions to be in profit and very hazardous martingale.
Read helpful article “10 keys to successful trading by “hazardous” Forex robots”
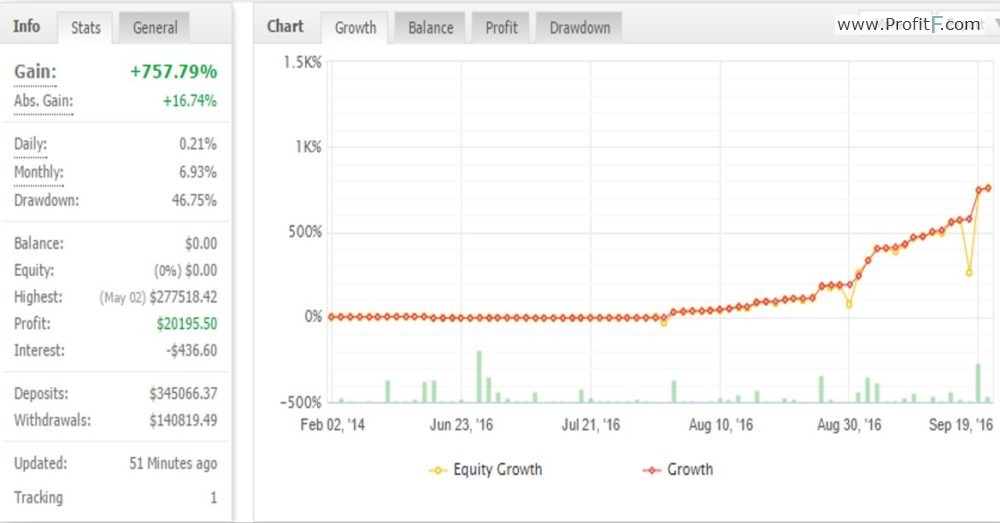
Here you can see another account demonstrating nice financial results, but have a relatively large drawdown. Now we’re going to try to copy trades into the chart to know the reason for this drawdown.
On the chart you can see a “fan” (pyramid) of orders typical for grid-based trading strategy. The grid has a fixed step value equal to 15 points. Lot increment represents a consequence of Fibonacci numbers. It appears that trades are made in two directions simultaneously for the purpose of partial hedging of risks. Nevertheless, the main task of such a strategy is to make it profitable to make a series of trades as quickly as possible. However, direction of the first trade is not justified by any forecast and has a purely random nature.
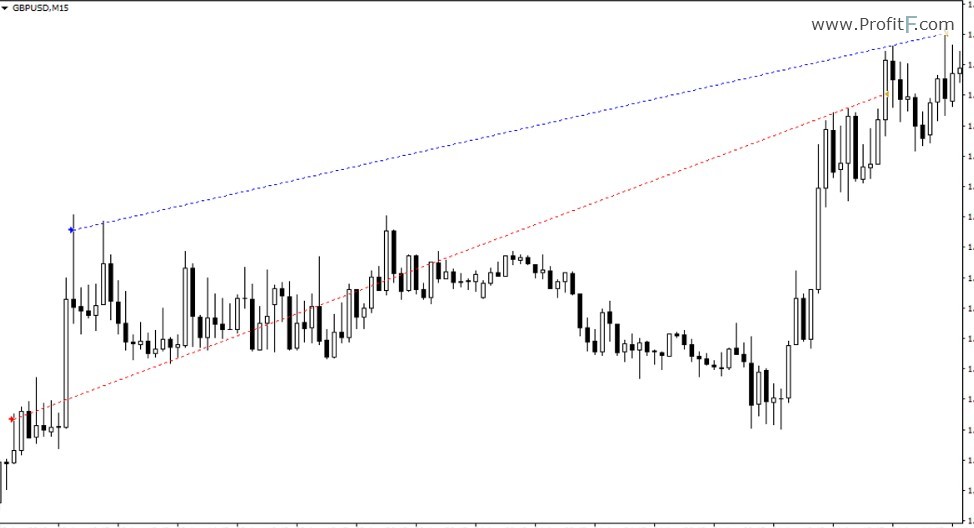
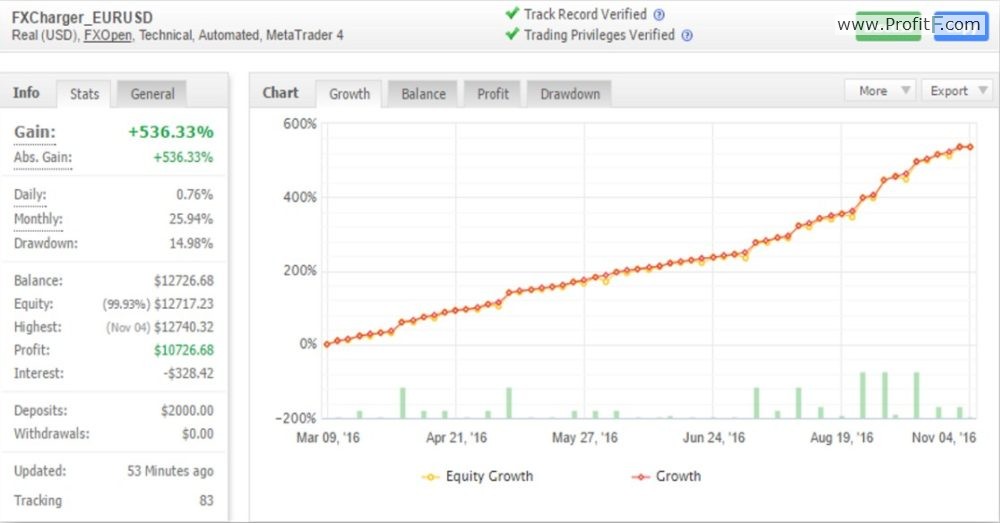
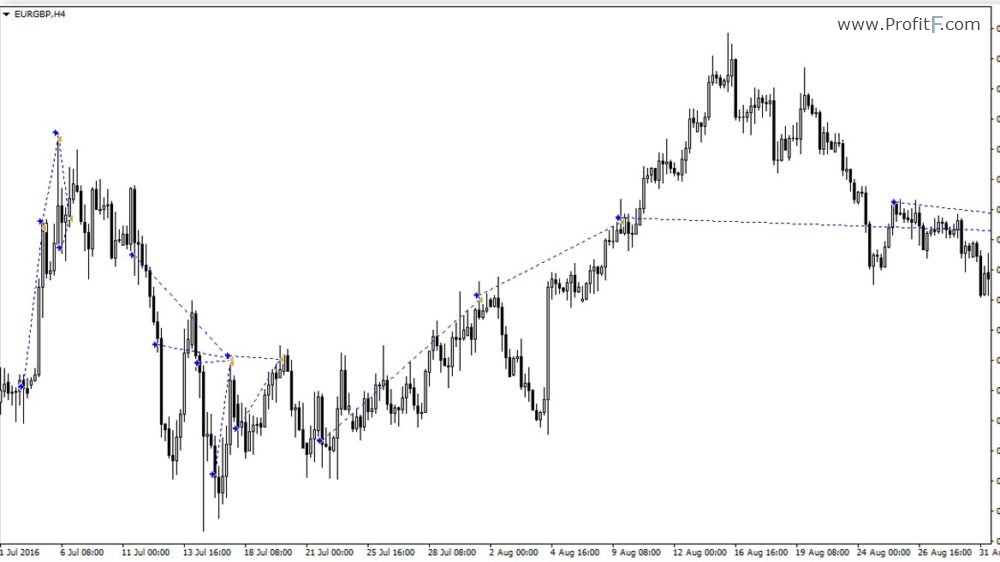
Here is another nice chart showing a little more modest results in terms of profit.
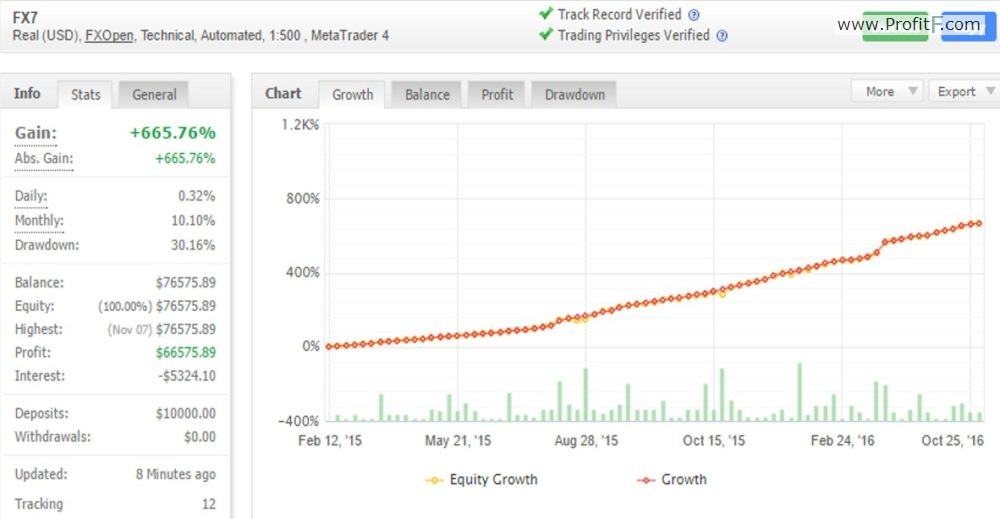
We can see signs of a trend-following strategy, if we look at the history of trades: a long holding period (“duration”) and large profits. The next step is to find out how a trade direction is determined. It’s most likely that a technical indicator, which has a relatively high value of its period, is used here, since a direction of trades is changed with a delay in relation to the time of start of the trend on a high time frame.
By analyzing a history of trades made based on profitable trading strategies one cannot only find ideas for his or her own trading system, but also get a working trading system “for free”. Open trading account and earn money 😉 Viewing trades on your terminal chart will give you a clearer picture than cold hard figures listed in statements of trades that doesn’t always allow you to filter out primitive grid-based strategies and other known to be hazardous strategies. The script will enable you to get a trading account history in just a couple of clicks and immediately display it on MT4 chart.

 (10 votes, average: 4.50 out of 5)