
The Dow Theory (by Charles Dow) is more than 100 years old and has stood the test of time. A few of its principles are as valid today as they were decades earlier. Though it was written for the equity markets, it can also be used to trade Forex profitably.
In this article (Dow Theory for Beginners), we will learn how to identify the primary or main trends as explained by the Dow Theory. We will also learn to tweak the entry and exit signals using Exponential Moving Averages and Trend lines and profit from it.
Determining trends
Trading with the trend is one of the best ways to make money in the Forex markets. Most new traders try to trade against the trend or enter very late and suffer huge losses. A sound knowledge of determining a trend in its initial stage can earn you handsome profits.
Dow theory can help us to determine a trend and trade with it.
According to Dow theory, a trend consists of three categories, Primary, Secondary, and Minor trends. Let’s understand all the three in detail and learn how to identify them on any chart.
Primary Trend
A primary trend also known as the main trend in a bull market is identified by a series of higher highs and higher lows. Price continuously makes a new high, retraces back approximately 33% to 66% of the rise and again continues to make new highs. The trend remains in force for one year to a few years. For a bear market, price forms lower highs and lower lows, all other things remain the same.
Bad results, unfavorable news, geopolitical events can cause small breaks in the primary trend, but the price quickly reverses back and continues in its original direction. Traders who identify the primary trend and continue to trade in its direction till it lasts are handsomely rewarded.
Using the Dow theory, we will attempt to identify the primary trend in the following chart.

It is easy to identify the primary trend in this chart. A series of higher highs and higher lows are marked on the chart.
Price on the left side of the chart was in a downtrend. The trend changed from down to up at the point marked by the thick arrow. At this point, the sequence of lower highs and lower lows were broken with price making a new high.
Once trend changed, it remained in force for almost a year. An example of a downtrend is shown in the next chart.
Trend change from Uptrend to Downtrend
Now we shall see how we can identify a primary trend in a bearish market. The following chart shows how an uptrend changed to a downtrend.
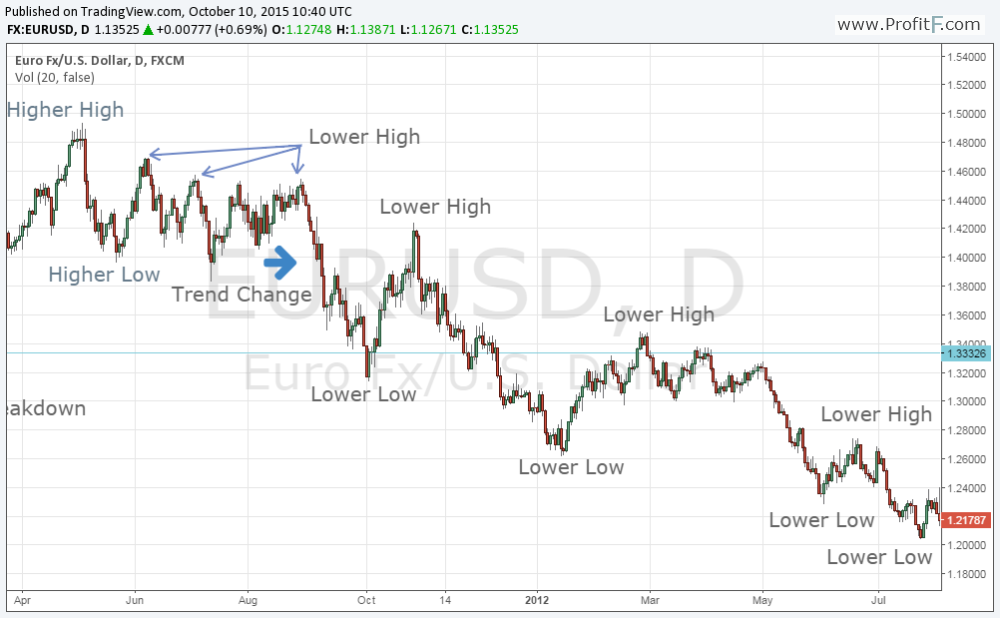
As seen in the chart, after a brief consolidation trend changed from bullish to bearish. A sequence of higher highs and higher lows were broken when a series of lower highs were formed. These are marked on the chart using multiple arrows, the break below the previous higher low confirmed a trend change. The new bearish trend remained in force for almost a year.
Secondary Trend
A secondary trend is a correction in the ongoing primary trend. The pullbacks can be anywhere between 33% to 66% of the main trend. Only in rare cases, the pullback can be up to 100% of the rise. The secondary trend continues for three weeks to three months after which the primary trend resumes.
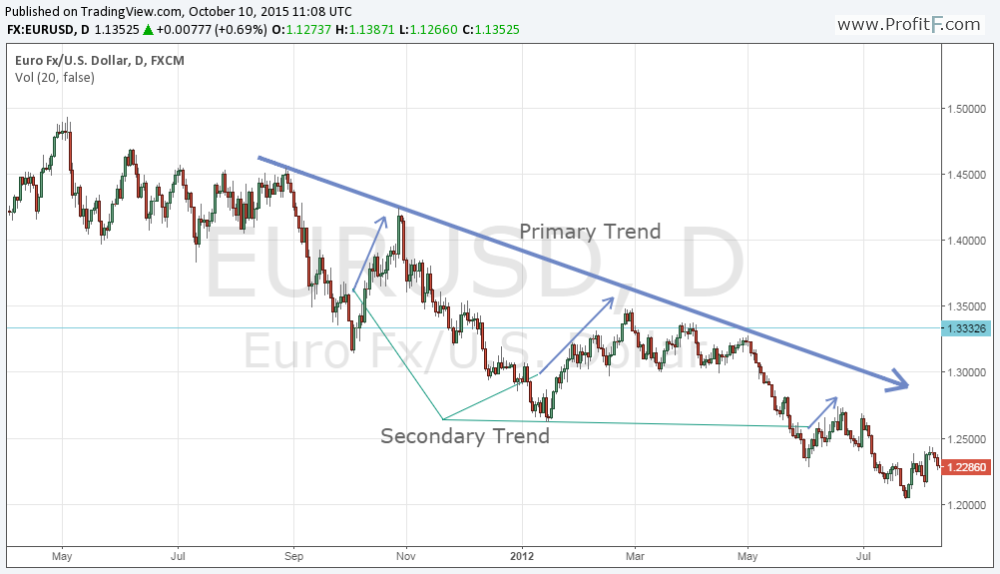
The secondary trend is marked on the chart above with thin arrows; the primary trend which is down is shown with a thicker arrow. The secondary trend is sharp and violent. After a sharp countertrend move, the primary trend resumes.
Minor Trend
Minor trend lasts a few hours to a few days, but not more than three weeks. It is random in nature and is not profitable to trade; it should be ignored according to Dow Theory. An attempt to trade the minor trends can lead to stop-loss hits, frustration, a string of losing trades and loss of confidence. It is therefore advised to always trade in the direction of the primary trend.
Phases of a Primary Trend
According to the Dow Theory, a primary bull trend consists of three phases. An accumulation phase where informed buyers start accumulating, followed by a steady phase where most of the trend followers enter the trend. And it ends with a blowout phase when everyone is into the trade.
A bearish trend starts with a distribution phase where informed investors sell their positions when everyone else is buying, trend followers start selling in the steady phase, despair grips most of the market participants and the blowout phase ends with a steep decline.
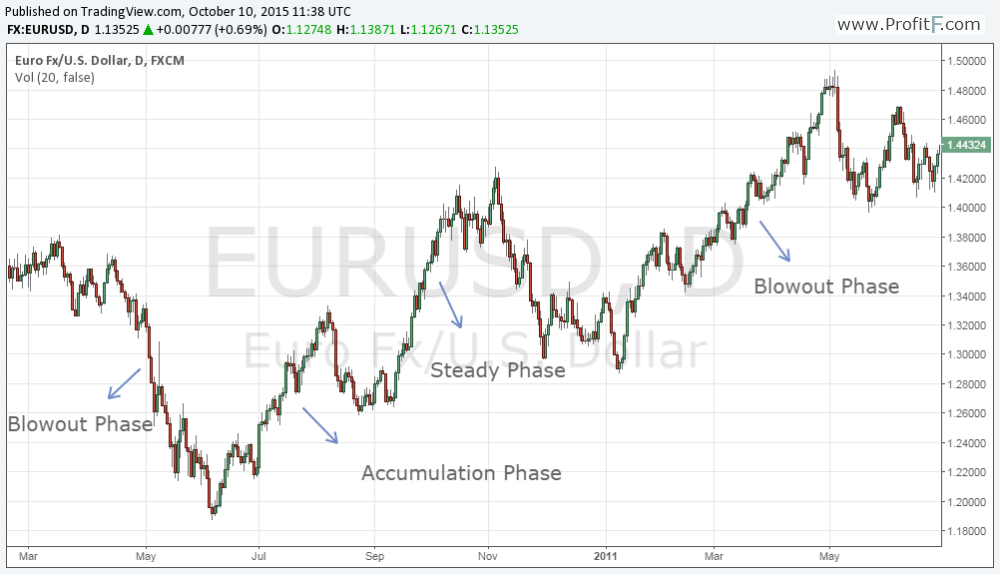
The left side of the chart shows the blowout phase for the downtrend. The accumulation starts after the downtrend, followed by steady and blowout phase which ends the uptrend.
Confirmation with volume
Dow Theory gives importance to volume and suggests a trend backed by volume is likely to be strong and continues for a longer duration compared to a trend which lacks volume.
Criticism of Dow Theory
Dow theory doesn’t identify a top or a bottom, it shows a trend change after almost 20-30% of the move has already occurred. Some traders criticize the Dow theory for this reason.
But it is important to note that only a handful of traders profit by identifying and trading the top and bottom turning points. Most successful traders are those who follow trends and earn decent profits by identifying the larger trends and staying with it.
How to use Dow theory in Forex
Dow theory was primarily designed for the equity markets. It has proved its mettle successfully over the last century in the equity markets. Its principles can be utilized in the Forex markets by combining the trend identification methods of Dow Theory with Trendlines and Moving Averages.
Examples of buy signal in an uptrend Using trends of the Dow theory, we shall identify buying opportunities in the following chart.
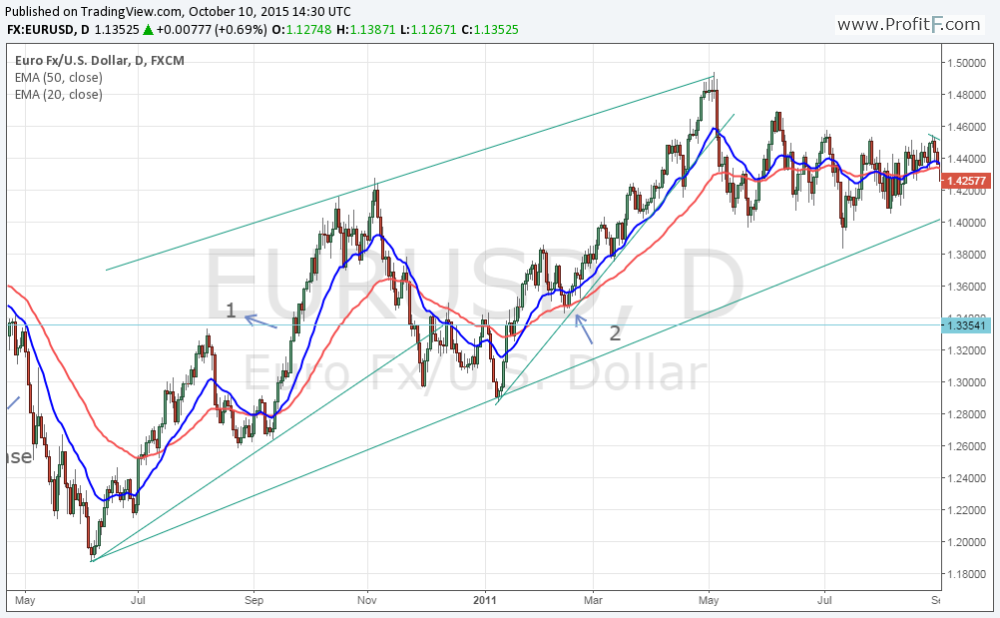
Point 1 is the beginning of an uptrend and a buy can be initiated at this point. We have already explained how to identify an uptrend. Traders can also use moving averages for entries. Point 2 on the chart shows an entry using moving averages. As the trend is up, we are looking only for buy signals.
After the secondary trend is completed, price resumes in the direction of the main trend. We wait for both the 20 and 50 EMAs to turn up, and price to break above both the moving averages. It retraces to point 2, where the 50 EMA provides support. A buy can be initiated when the price moves above the 20 EMA again. The trend lines in this chart cannot be used for generating buy signals, but they can be used to take profits on the long positions.
Examples of Sell signals in a downtrend
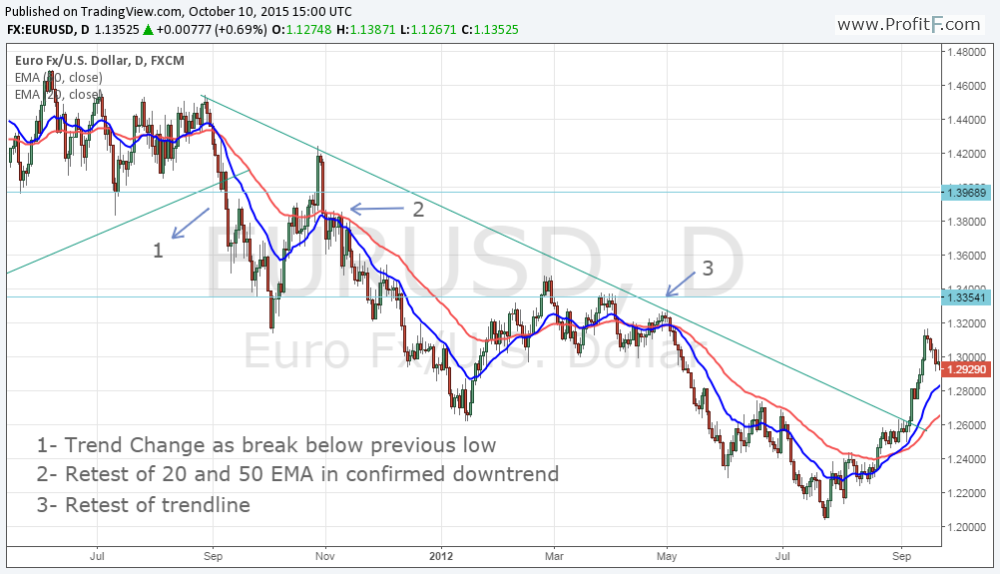
There are three shorting opportunities in the above chart.
Point 1 is a Dow Theory sell signal, as already explained in earlier charts. A short can be initiated at the breakdown point.
Point 2 is a confirmation of resumption of the primary trend after a secondary trend which retraces almost two-thirds of the fall. Price breaks below the 20 & 50 EMA, both the EMAs turn down, price retests the EMAs at point 2 and fails. We enter here when price breaks below the 20 EMA.
Point 3 is a shorting opportunity on a retest of the downtrend line. Shorts can be initiated on a move below the 20 EMA.
Placing a Stop Loss
We have two buy signals and three sell signals from both the charts, we have used very basic rules where we identify the primary trend and trade in its direction using Moving Averages and Trendlines. We don’t attempt to trade the secondary trends and minor trends.
Though we have a good entry point on all the trades and price moves favorably in our direction of trade, without a proper stop loss we will not be able to profit handsomely.
A trend change confirmation signal using the Dow theory comes very late; it will be difficult to use it in Forex Trading. Therefore, we should tweak the exit signals and trail our Stop losses just below the 20 EMA for uptrends and above the 20 EMA for downtrends.
Conclusion
New traders spend a lot of time with complex indicators and search for the holy grail of trading. It is better to learn the basics of Dow theory and identify the primary or main trend. Entry and exit points can be tweaked according to their own trading style.
We have shown, how you can use moving averages and trendlines to identify profitable trading opportunities in the direction of the primary trend. These are general guidelines, nip it to suit your requirement and profit from it.
Dow Theory in PDF >>> (free ebooks)
 (7 votes, average: 5.00 out of 5)


Add your review