
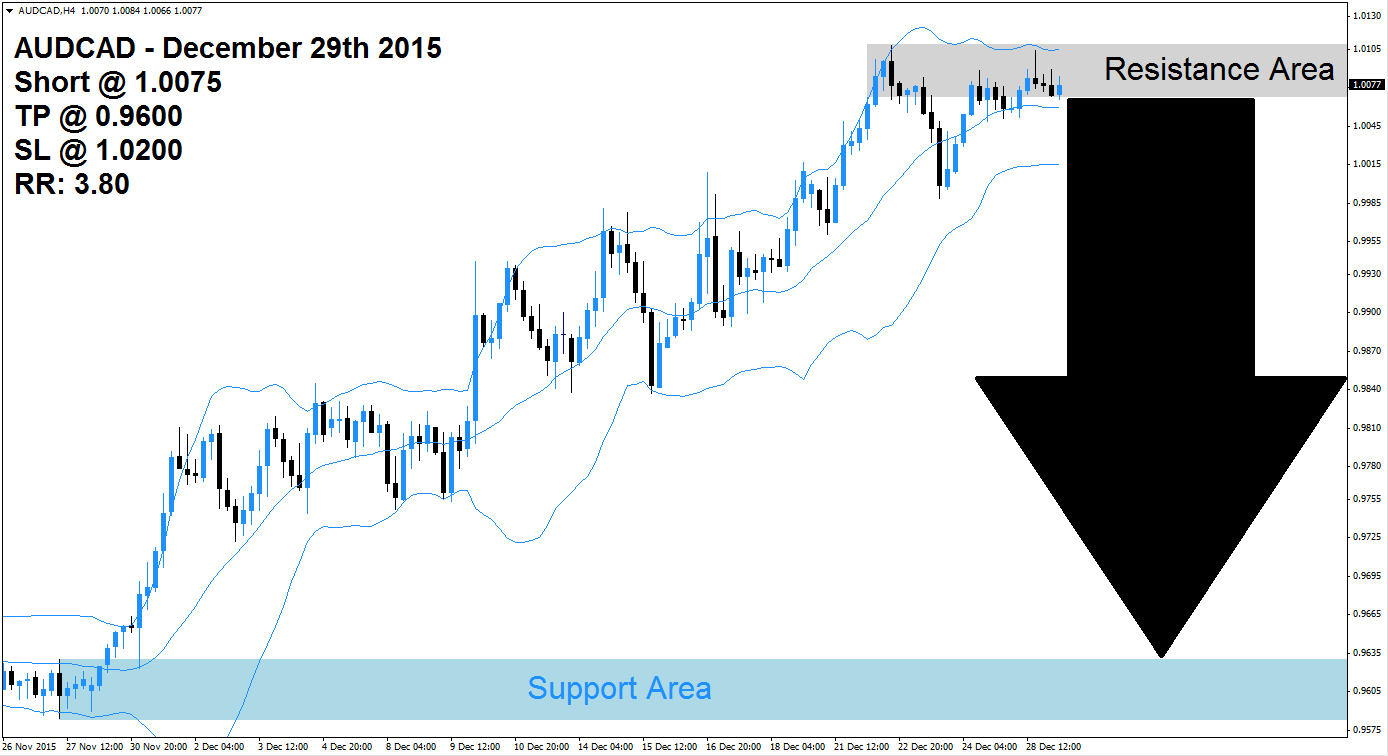
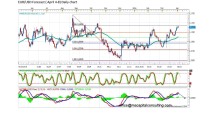
The AUDCAD is trading inside of its resistance area, marked in light grey in the above H4 chart, following a solid rally which took this currency pair away from its support area visible in light blue. The Bollinger Band indicator support the strong advance and price action was moving higher between the lower band and the upper band. After the AUDCAD moved into its resistance area, the Bollinger Band started to trade sideways which may signal the end of the rally.
This currency pair is located above the middle Bollinger Band which is trading below the resistance area and below the upper Bollinger Band which is trending inside of it. Forex traders may opt to take profits, especially if the sideways trend will last, which will result in a profit-taking sell-off. A breakdown in the AUDCAD below the resistance area as well as below the middle Bollinger Band will result in the addition of new net short positions.
Forex traders are advised to enter short positions at 1.0075 and above in order to be well position for the expected profit taking sell-off in this currency pair and a breakdown in price action. Conservative forex traders are advised to wait for the breakdown below the middle Bollinger Band which will increase selling pressure in this currency pair. A take profit target of 0.9600 has been selected for a potential trading profit of 475 pips.
Forex traders should protect this trade with a stop loss level at 1.0200 for a potential trading loss of 125 pips which will result in a Risk-Reward (RR) ratio of 3.80.
AUDCAD
Short @ 1.0075
TP @ 0.9600
SL @ 1.0200
RR: 3.80
 (1 votes, average: 5.00 out of 5)
Add your review