
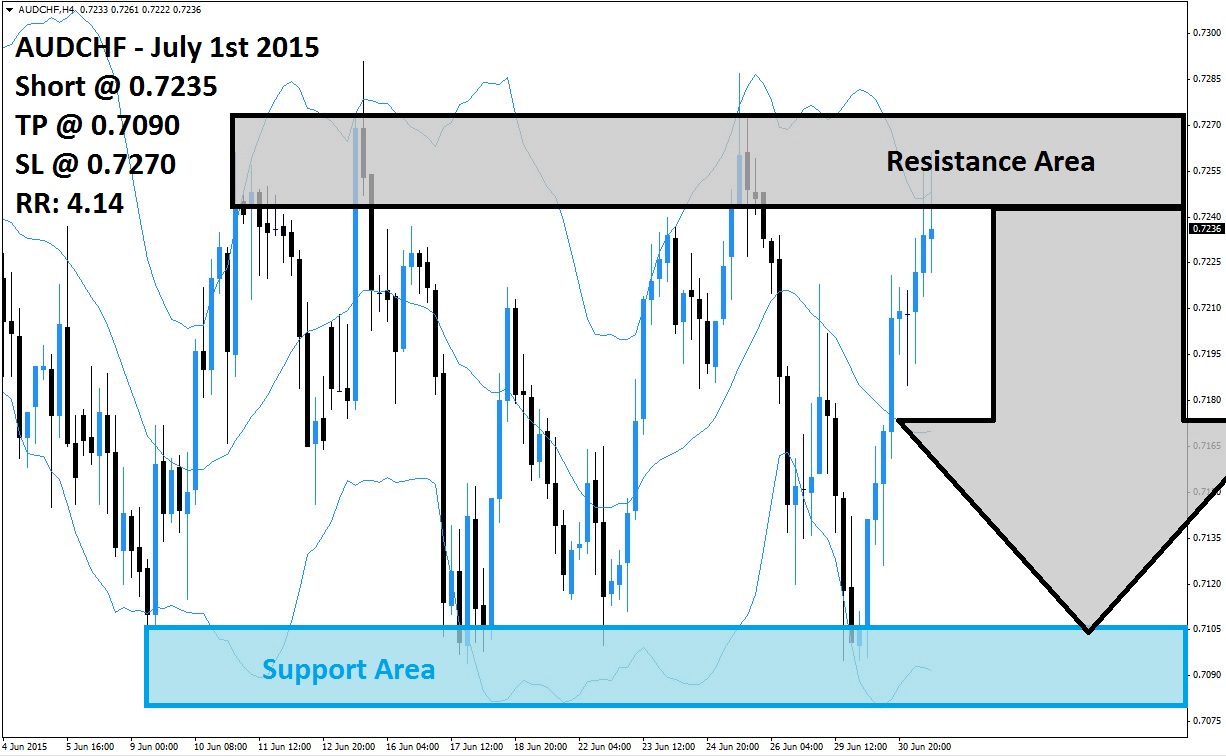
The AUDCHF has rallied after touching its support area which is visible in light blue in the above H4 chart. Price action caught a short-covering rally as sellers stepped aside and forex traders decided to realize floating trading profits after a fast collapse in the AUDCHF from its resistance area visible in light grey in the above forex chart. The AUDCHF was faced with plenty of rapid moves inside of its current trading range.
The upper band of its Bollinger Band Indicator is currently trading inside of its resistance area while the lower band is trading inside its support area. This reflects the volatile trading action to which this currency pair was exposed. The middle band is sloping to the downside and the AUDCHF is currently trading between its middle band and its upper band. More volatility is ahead for this currency pair which is not expected to move outside of its established trading range.
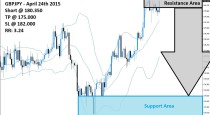
Forex traders are recommended to seek short positions at 0.7235 and above in order to be positioned for the expected reversal which could be fueled by another round of profit taking. A breakdown below the middle band of its Bollinger Band indicator will switch momentum and conservative forex traders are advised to wait the breakdown. The drawback would be the missed pips which would be left on the table. A take profit target of 0.7090 has been selected for a potential trading profit of 145 pips.
Forex traders should protect this trade with a stop loss level at 0.7270 for a potential trading loss of 35 pips which will result in a Risk-Reward (RR) ratio of 4.14.
AUDCHF
Short @ 0.7235
TP @ 0.7090
SL @ 0.7270
RR: 4.14
 (No Ratings Yet)
Add your review