
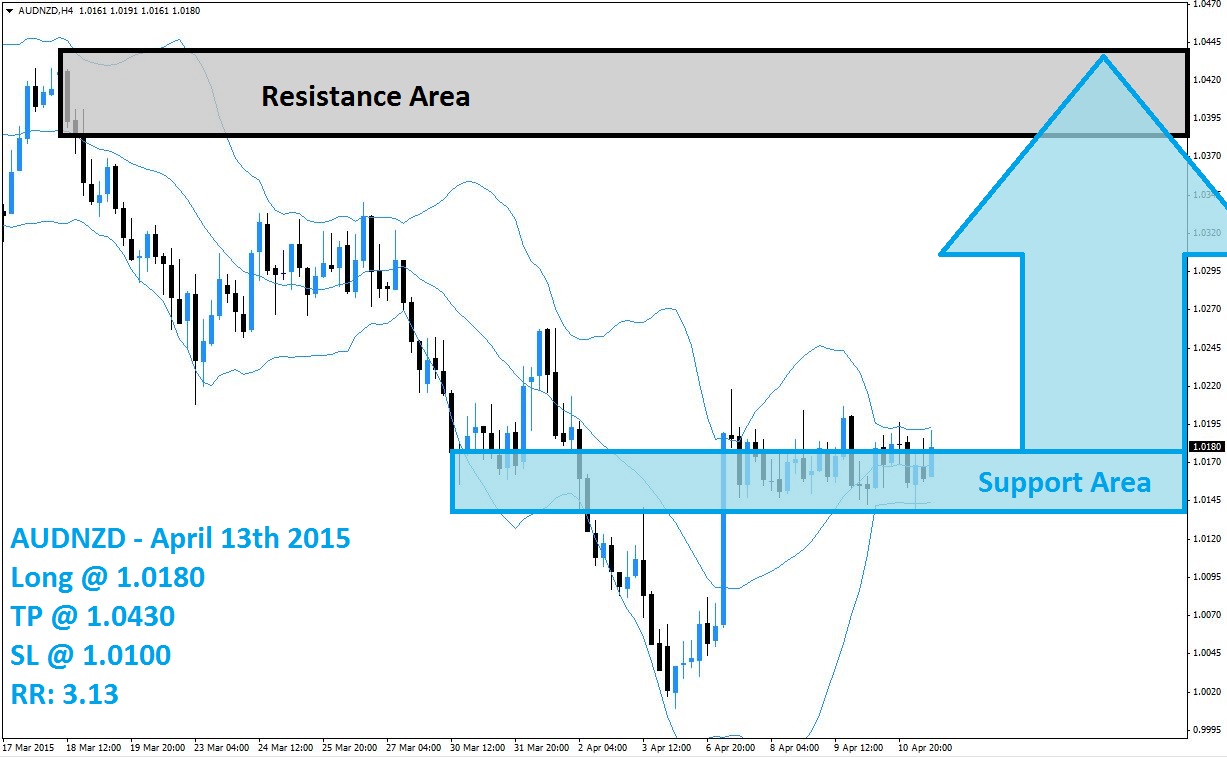
The AUDNZD has recovered from its most recent capitulation sell-off which took this currency pair well below its support area, visible in light blue in the above H4 chart, but the sell-off left the AUDNZD in extreme oversold territory. From this level buyers stepped in and forex traders decided to realize floating trading profits especially after the brief breakdown below the important 1.0000 level or parity. Having the AUDNZD trade below parity is not a sustainable level and a quick reversal of the downtrend was to be expected.
The Bollinger Band indicator, which previously supported the sharp sell-off as the upper band prevented a breakout from occurring, reversed as well and has now developed a sideways trend with the lower band supporting the bottom of its support area. The selling pressure has been broken with the counter-trend rally powered by massive short-covering. The AUDNZD is now attempting to turn the reversal rally into a breakout rally which would allow this currency pair to move into its resistance area, visible in light grey in the above chart.
A breakout above the upper Bollinger Band will result in a complete reversal in momentum. Forex traders are recommended to take long positions at 1.0180 and below. A take profit target of 1.0430 is recommended for a potential trading profit of 250 pips on the H4 Chart. A breakout above its support area as well as the upper Bollinger Band is likely to invite additional buy orders.
Forex traders should protect this trade with a stop loss level at 1.0100 for a potential trading loss of 80 pips which will result in a Risk-Reward (RR) ratio of 3.13.
AUDNZD
Long @ 1.0180
TP @ 1.0430
SL @ 1.0100
RR: 3.13
 (No Ratings Yet)
Add your review