
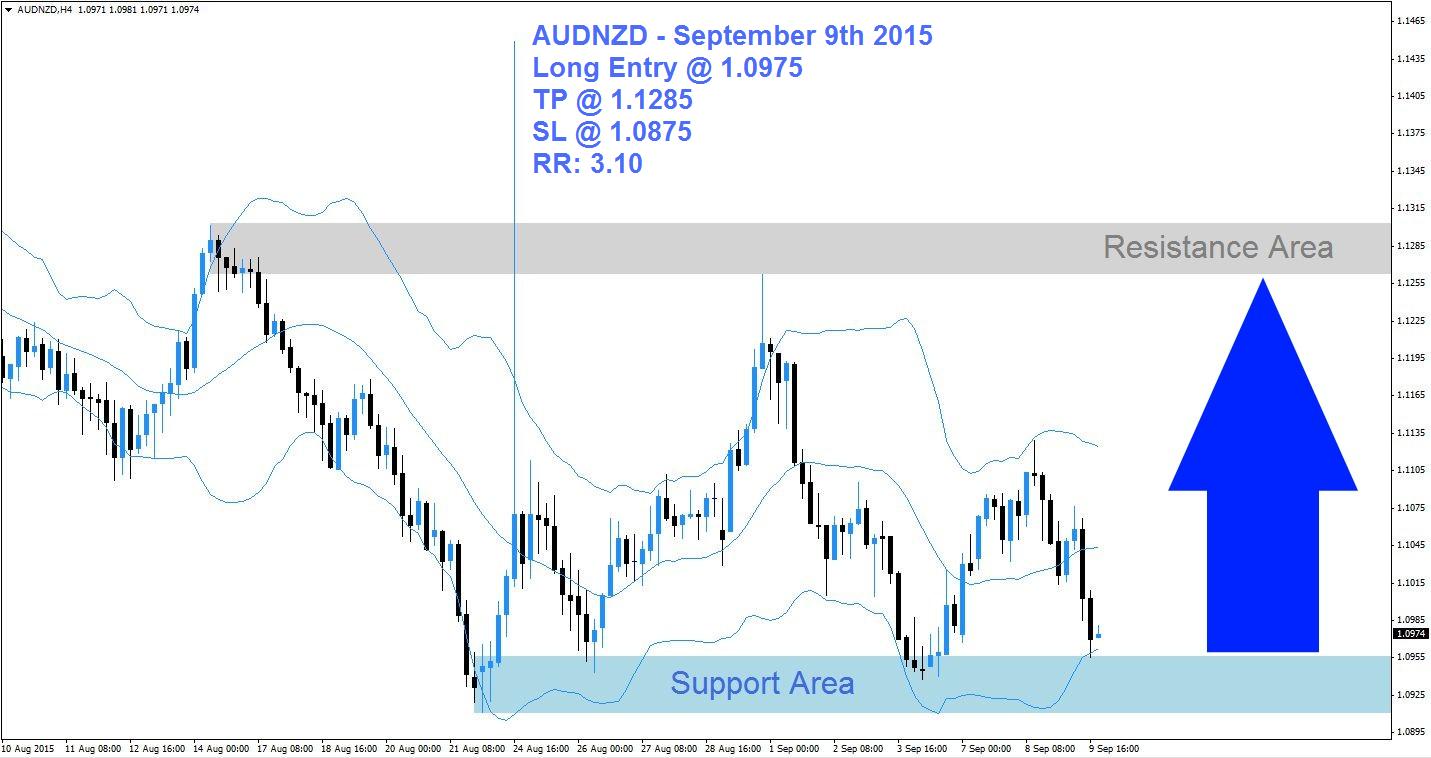
The AUDNZD corrected from its resistance area marked in light grey in the above H4 chart into its support area visible in light blue. This currency pair has been stuck in this trading range as sellers stepped in once price action reached the resistance area and buyers stepped in each time this currency pair dropped into its support area. It is unlikely that the trend will change over the next few trading sessions.
The Bollinger Band indicator confirmed the sideways trend in this currency as the lower band, the middle band and the upper band are all three trading sideways inside of the trading range. The AUDNZD is now trading close to its support area and forex traders may opt to realize floating trading profits by exiting their short positions. This is likely to lead to a short-covering rally which will take this currency pair back into its resistance area.
Forex traders are advised to seek long positions at 1.0975 and below this level which will position their trading accounts to profit from the expected short-covering rally. Conservative forex traders should wait for a breakout above the middle band of it Bollinger Band indicator before entering their long positions. A take profit target of 1.1285 has been set for a potential trading profit of 310 pips on the H4 Chart. More buy orders are expected after the AUDNZD completes its breakout above the middle Bollinger Band.
Forex traders should protect this trade with a stop loss level at 1.0875 for a potential trading loss of 100 pips which will result in a Risk-Reward (RR) ratio of 3.10.
AUDNZD
Long @ 1.0975
TP @ 1.1285
SL @ 1.0875
RR: 3.10
 (No Ratings Yet)
Add your review