
The AUDNZD rallied strongly after trading below its support area which is visible in light blue in the above H4 chart. Momentum started to shift from bearish to bullish after one H4 candlestick breached the middle band of its Bollinger Band indicator. This move was followed by a breakout above its support area, which until this point served as a resistance area, and the AUDNZD rallied between its middle band and its upper band until a price reversal stopped this move.
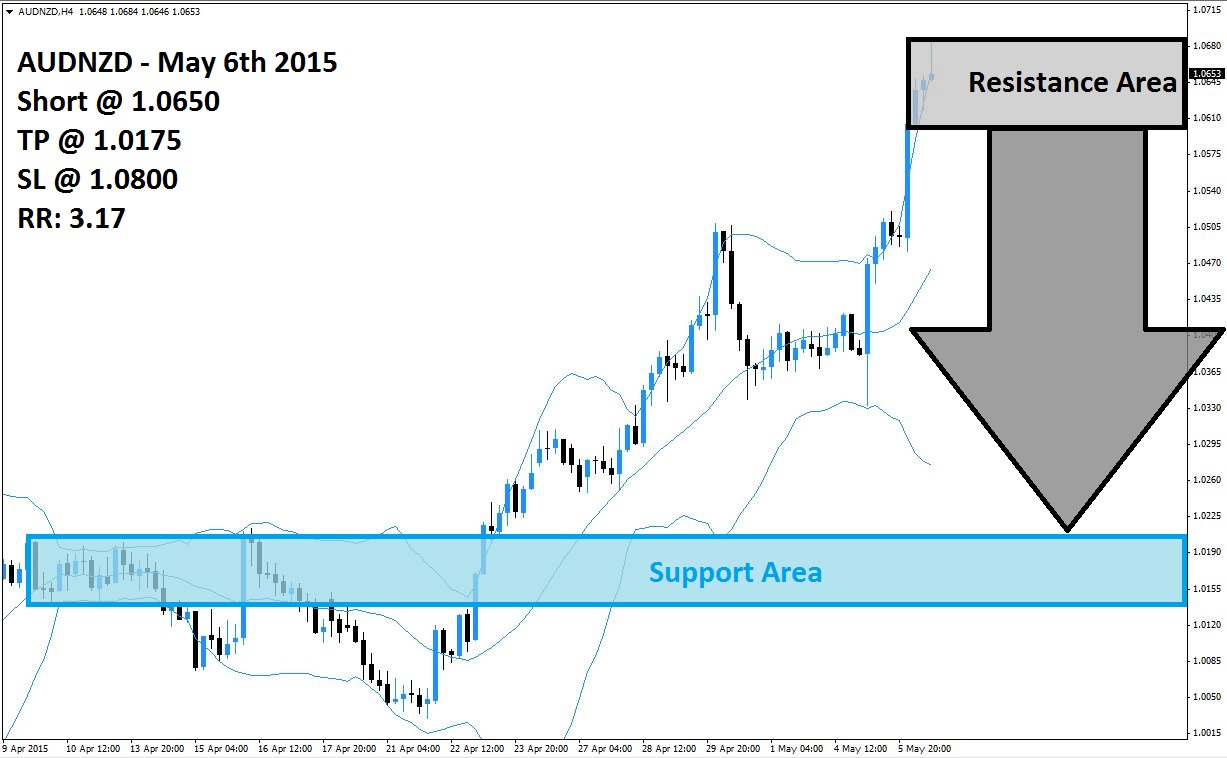
The expected RBA interest rate cut has caused a volatile trading session yesterday which saw the AUDNZD briefly touch the lower band of its Bollinger Band indicator before accelerating to the upside. The current H4 candlestick shows an inverted hammer which formed inside of its resistance area, visible in light grey in the above chart, which is a very bearish trading signal. This may prompt forex traders to realize floating trading profits and close their long positions which will accelerate the expected sell-off in this currency pair.
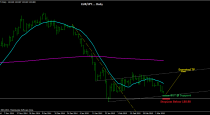
Forex traders are advised to position their portfolio with short positions at 1.0650 and above in order to be able to profit from a contraction in the AUDNZD. A sideways trend could develop prior to the breakdown as the lower band of the Bollinger Band is sloping to the downside while the middle band and the upper band are both sloping to the upside. A take profit target of 1.0175 has been selected for a potential profit of 475 pips.
Forex traders should protect this trade with a stop loss level at 1.0800 for a potential trading loss of 150 pips which will result in a Risk-Reward (RR) ratio of 3.17.
AUDNZD
Short @ 1.0650
TP @ 1.0175
SL @ 1.0800
RR: 3.17
 (No Ratings Yet)
Add your review