
Subscribe to Updates (Weekly forex analysis by Stephen L) via Email
The pair is up aganst a resistance near 0,76. Shorter term graphs suggest it should rather reject it, but if it breaks it up, the next resistance is around 0,785.
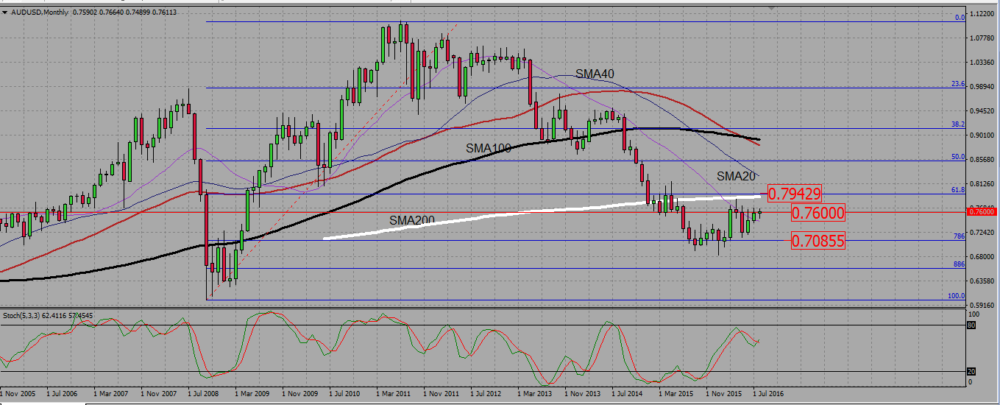
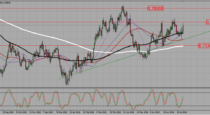
On the monthly chart, the pair is facing a resistance near 0,76. There is no clear trend, and basically this is all there is to say about that chart.
AUDUSD MONTHLY CHART.
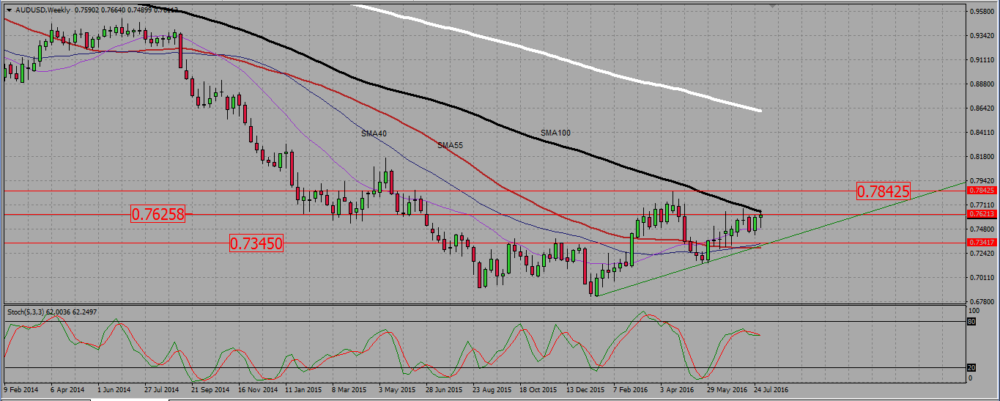
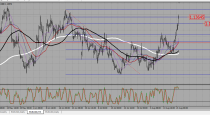
The weekly chart holds much more information. 100 and 200 SMAS tell us it is is a downtrend, but the pair has been consolidating up since January since year in a kind fof bullish triangle, with a resistance near 0,76 , that has been broken once, but the pair then rejected a resistance near 0,785 and went back under the 0,76 resistance. This week candle shows a trial at breaking up once again that level, but it ended with a doji, and we see the 100 SMA being just above that level too. With such a weak bullish consolidation, chances are the pair is going to reject that level and to go back down to the support TL.
AUDUSD WEEKLY CHART.
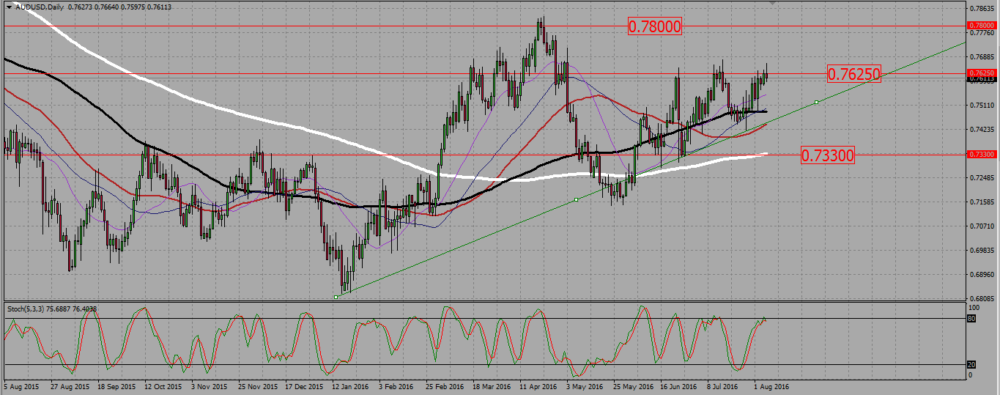
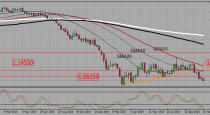
On the daily chart, we have a better view of what is happening within that bullish triangle. We see a potential triple top situation near 0,76 0,7625, but there is no bearish signal yet. We only have a dark cloud cover pattern, (see more about forex patterns) and it is not considered as a valid reversal signal. Also, in case of a bullish reversal, the first support (take profit) level is very close, as it is the support trend line which will be around 0,75. If the pair goes down, it is better to wait for a break down of that level before entering a trade.
AUDUSD DAILY CHART.
 (1 votes, average: 5.00 out of 5)
Add your review