
FREE – Subscribe to this Forex analysis via Email
AUDUSD trading plan.
Watch price action near 0,76, for a bullish break up towards 0,785 and 0,795, or for a reversal towards 0,733. In that case , mind a daily support trend line on the way down.
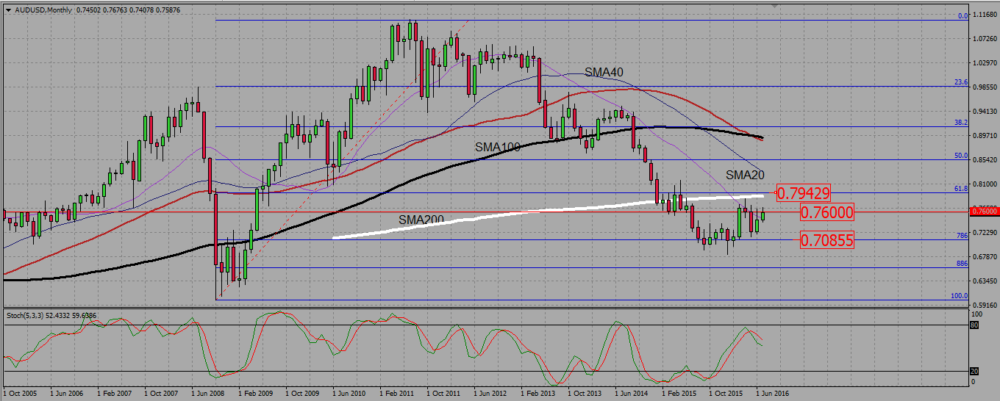
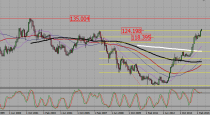
The monthly chart shows the pair trying to break up a resistance near 0,76. If it manages to get through, it should go up towards the 0,795 resistance or the 200 SMA just below. If it can’t, it should go down to a support near 0,733. There is no clear trend on that chart.
AUDSUSD MONTHLY CHART.
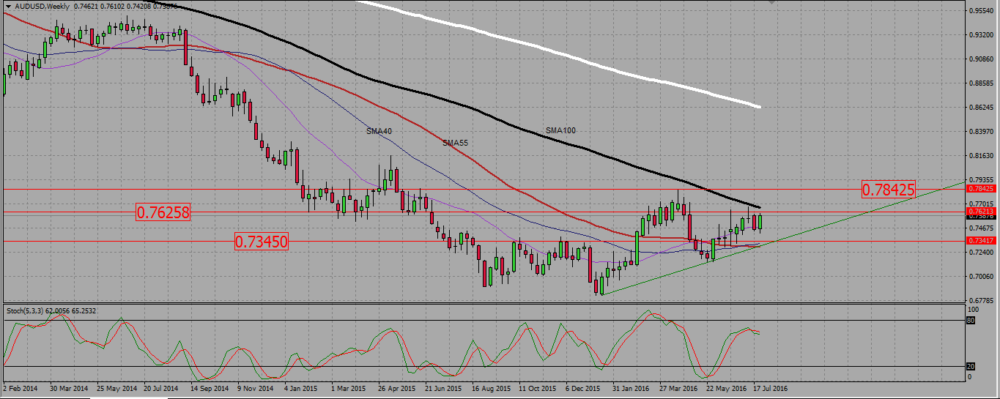
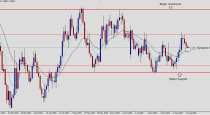
The 0,76 resistance retest is very clear on the weekly chart, which also shows a bearish configuration. The 100 SMA is rushing down to meet 0,76 very soon, making it even stronger. For the moment the pair looks to consolidate within a bullish triangle, with a support trend line and an unclear resistance level, somewhere within 0,76 and 0,78.
AUDUSD WEEKLY CHART.
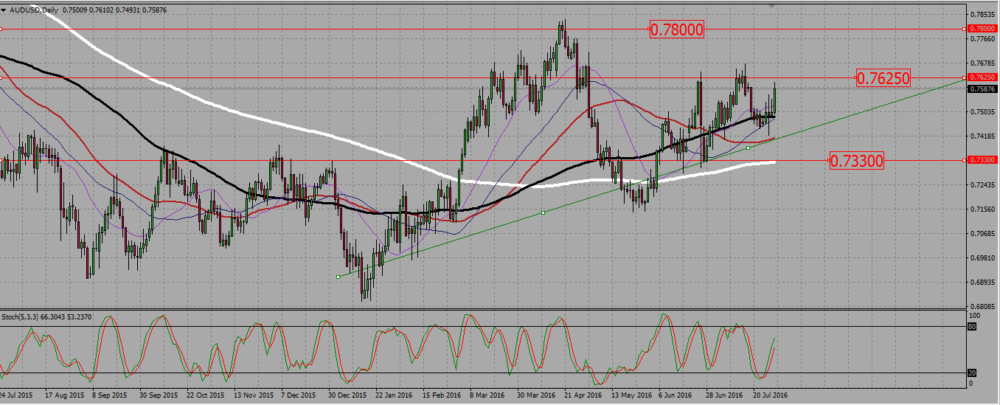
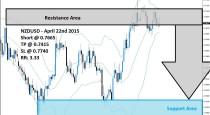
The daily chart better shows that bullish triangle, with a support trend line as old as December 2015, but that has been broken once. We clearly see one resistance near 0,76 – 0,7625 and another near 0,78. This is the three levels we need to watch for trading signals, keeping the trend line in mind if we sell the pair.
AUDUSD DAILY CHART.

 (3 votes, average: 4.67 out of 5)
Add your review