
1-FIBBING AROUND THE CABLE : A GU ANALYSIS AND TRADING PLAN.
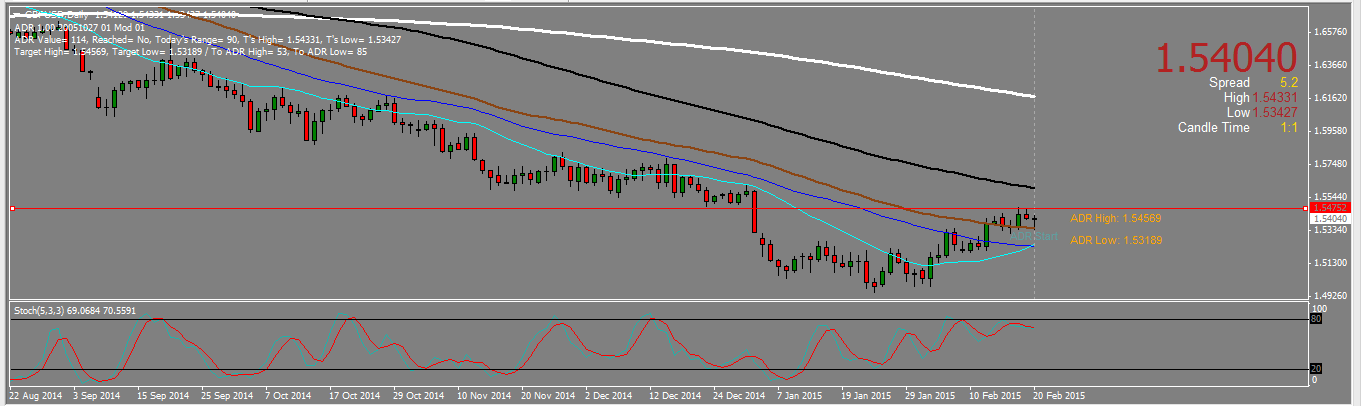
On the daily, GU was in a nice downtrend, then turned back and entered a strong bullish move. But it recently gave a double top and is now seems to be in a ranging/consolidation mode.
GU DAILY CHART.
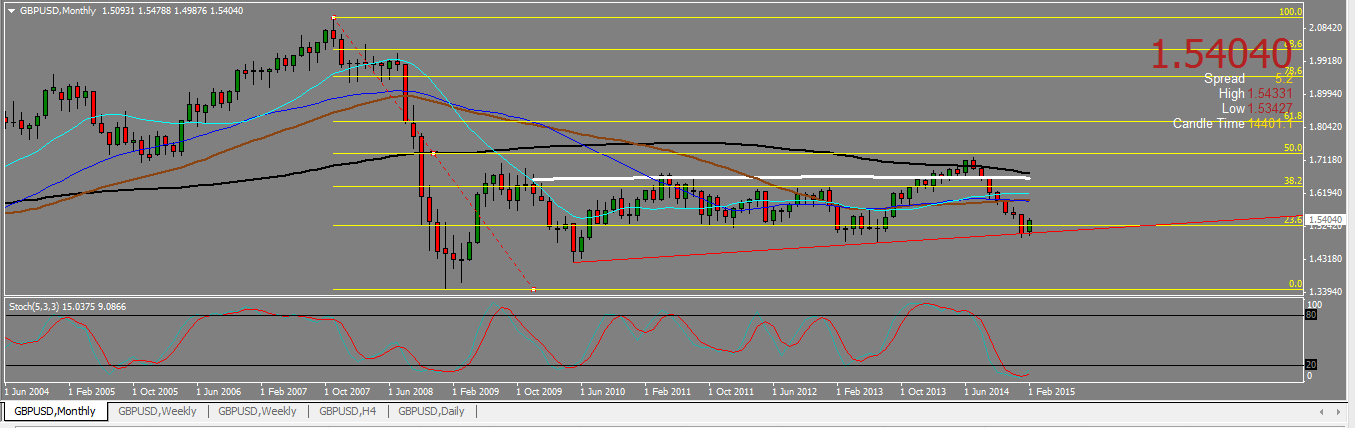
Taking a look at the monthly, we see GU being at the bottom of a range. It bounced already two times from that level, and now seems to be bouncing again : we are rather long term bullish for the cable.
GU MONTLY CHART.
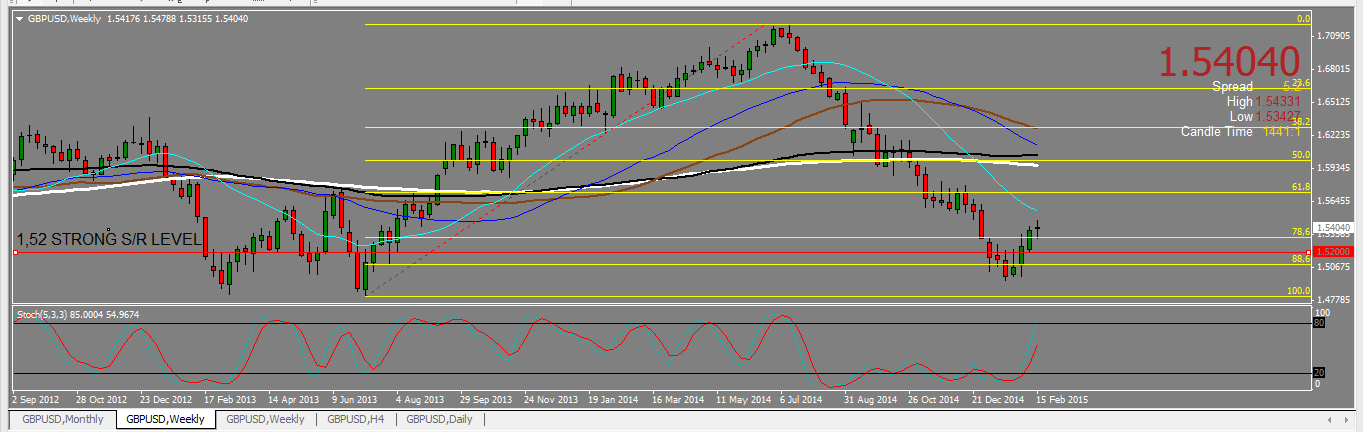
The weekly time frame delivers also interesting indications, depending upon which fib you are looking at.
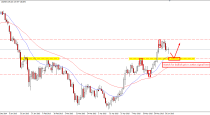
In a first approach, let us consider the the fib from the previous bullish move. We may see we broke up tje ,786 fib level around 1,5325, and now are retesting it ; it is a support. Please note also the very strong support level at 1,52.
GU WEEKLY CHART 1.
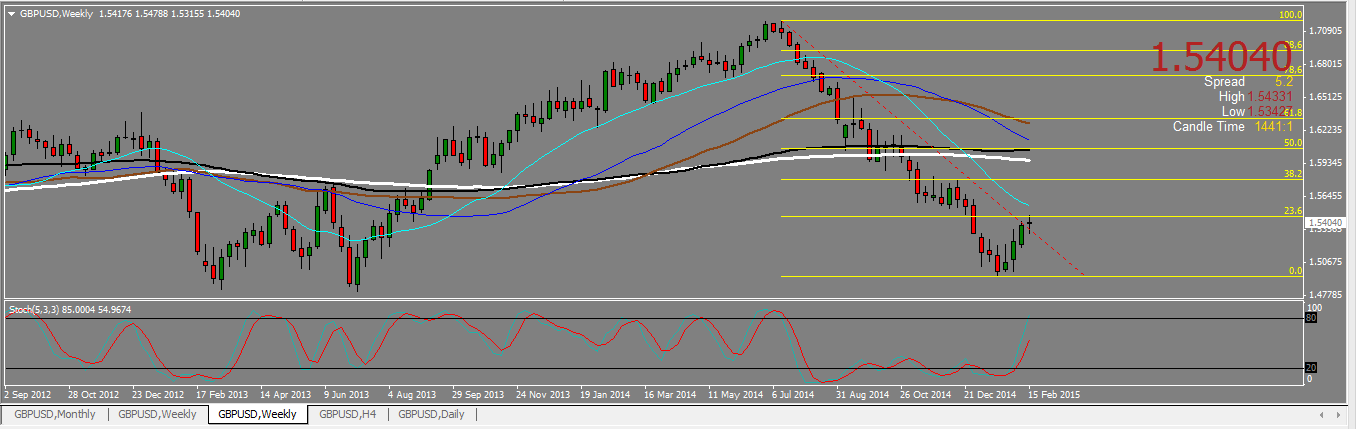
But if we change the fib, and now take into consideration the one from the last bearish move, we see the pair is now capped by the 23,6 level as a resistance around 1,5475. This is where our double top took place. It will be our resistance.
GU WEEKLY CHART 2.
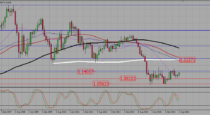
All we have to do is now to report those levels on a H4 chart, and our trading plan is ready.
GU H4 CHART.
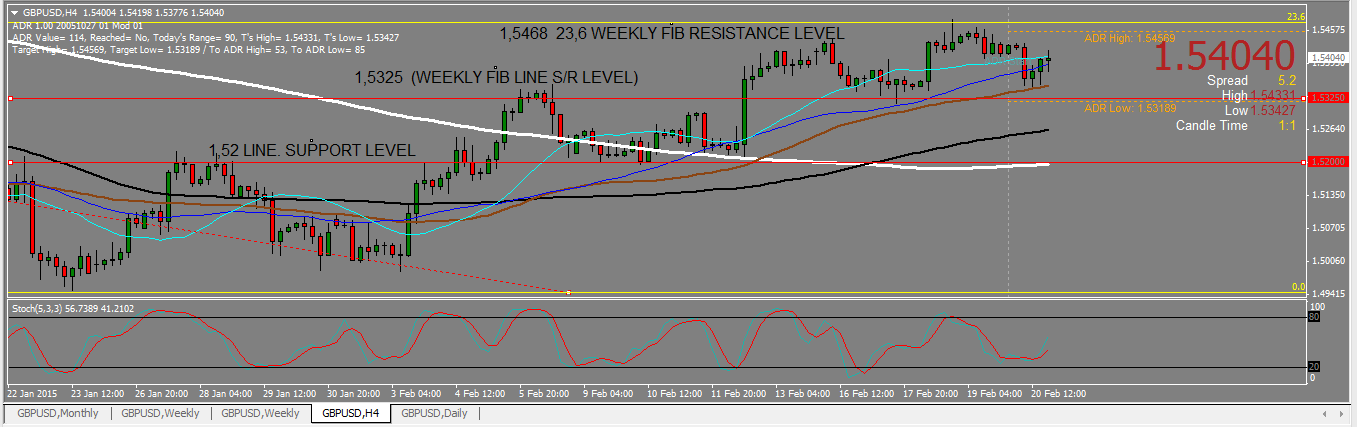
The cable entered a range. We will then take reversals inside the range, that means short on a bearish signal around 1,5475, and long on a bullish one around 1,52. Our take profits will be the opposite side of the range, but we will not close the whole trade at that level, keeping a small part open in case the move keeps going on. We will also watch the 1,5325 level for it is a support/resistance line: we will not allow the trade to reverse on us at that level, and should anything happen on H1/m15 we will close it ; we may even considering entering long at that level. Finally, we will trade also a break out of the range, adding to/entering a position after a retest and a confirmation of that break out on H4.
2-AUDNZD: GOING BACK NORTH ? ANALYSIS AND TRADING PLAN.
Last week we mentioned AUDNZD as a bearish opportunity. The pair opened with a small weekly bearish gap around 1,038, and give a short signal while retesting it. It made then a 80 pips fall down to 1,03. But the last two days showed a rejection of that level, with a hammer followed by a bullish continuation candle. The pair even managed to slightly close above last week’s gap at 1,04.
AUDNZD DAILY CHART.
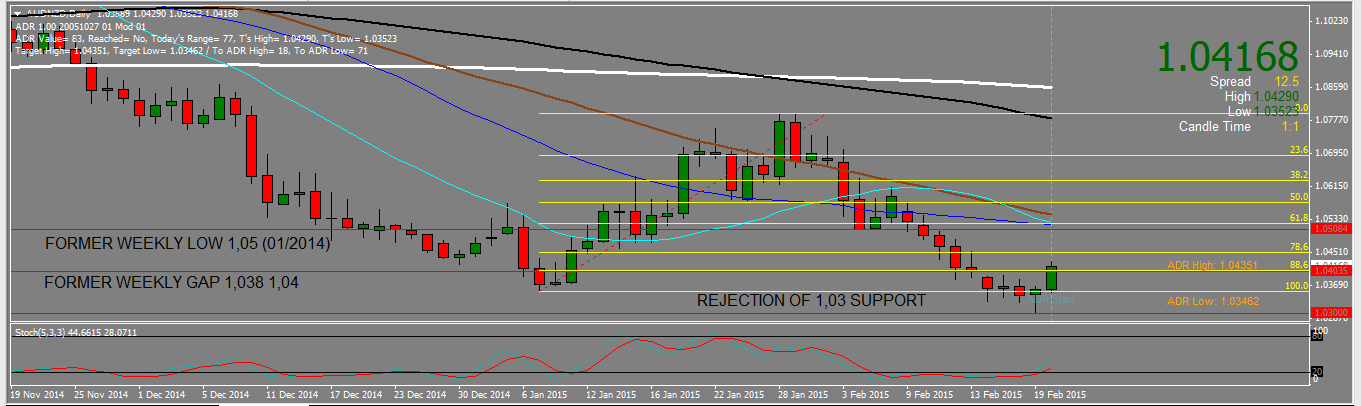
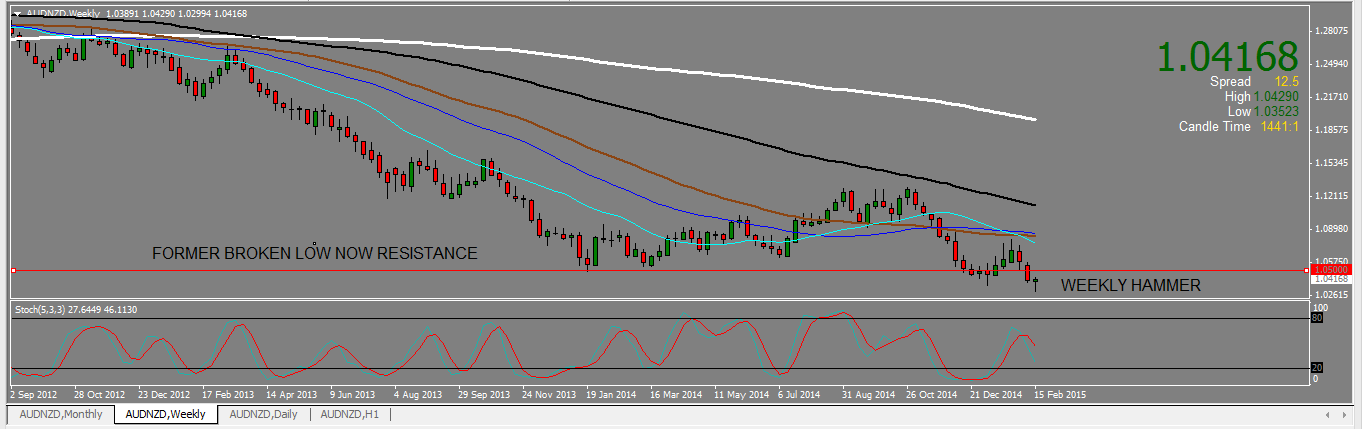
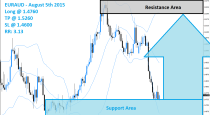
As the closing weekly candle is a also a hammer, we now have to think bullish. Therefore we will be buying dips on H4 above 1,03, ideally on a retest of the 1,04 level. Let us keep an eye on two important resistances at 1,045 (,786 fib level resistance) and 1,05 (former weekly low). At those levels, a bearish reversal figure on lower time frames (H1/m15) would be a sign to close the trade. But should that bearish reversal be confirmed on the H4 time frame, we will enter a small position short. We will wait to see the 1,03 level broken down, retested and confirmed to enter with a full position short.
AUDNZD WEEKLY CHART.
3-A CHART YOU DO NOT WANT TO TRADE.
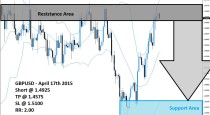
When analyzing charts, you do not always have to make a trading plan. There are some charts you just do not want to trade. The Daily EURCAD is clearly one of them.
EURCAD DAILY CHART.
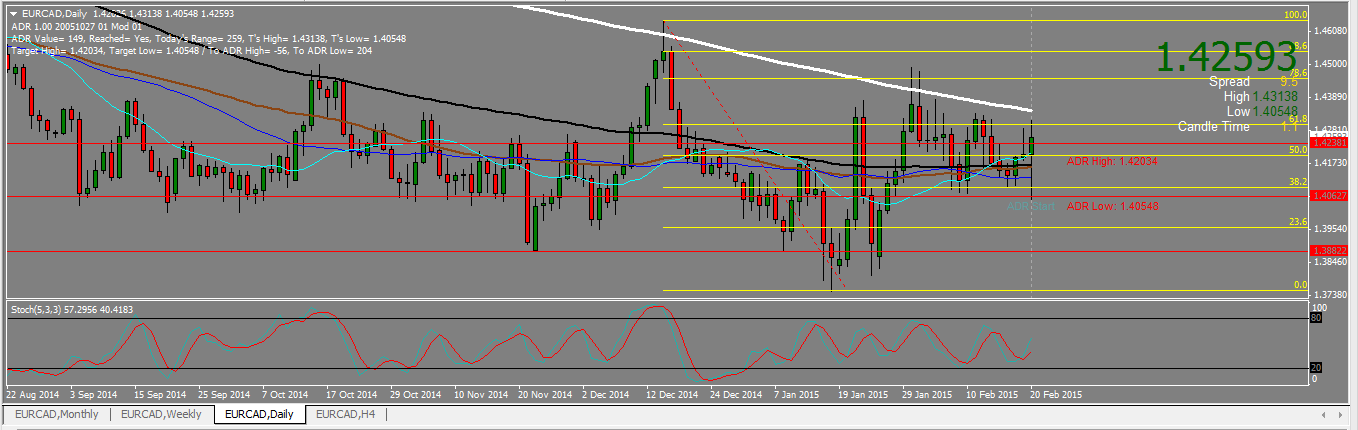
1-The pair is ranging without clearly defined resistances or supports,
2-The SMAs are mixed and tangled, looking like spaghetti,
3-There are wicks everywhere, making managing stop losses quite impossible.
When you encounter that kind of chart, it is better to stay away. Even if the SMA200 is as clear resistance, as it is here. (read more about SMA indicator on our website)
 (No Ratings Yet)
Add your review