
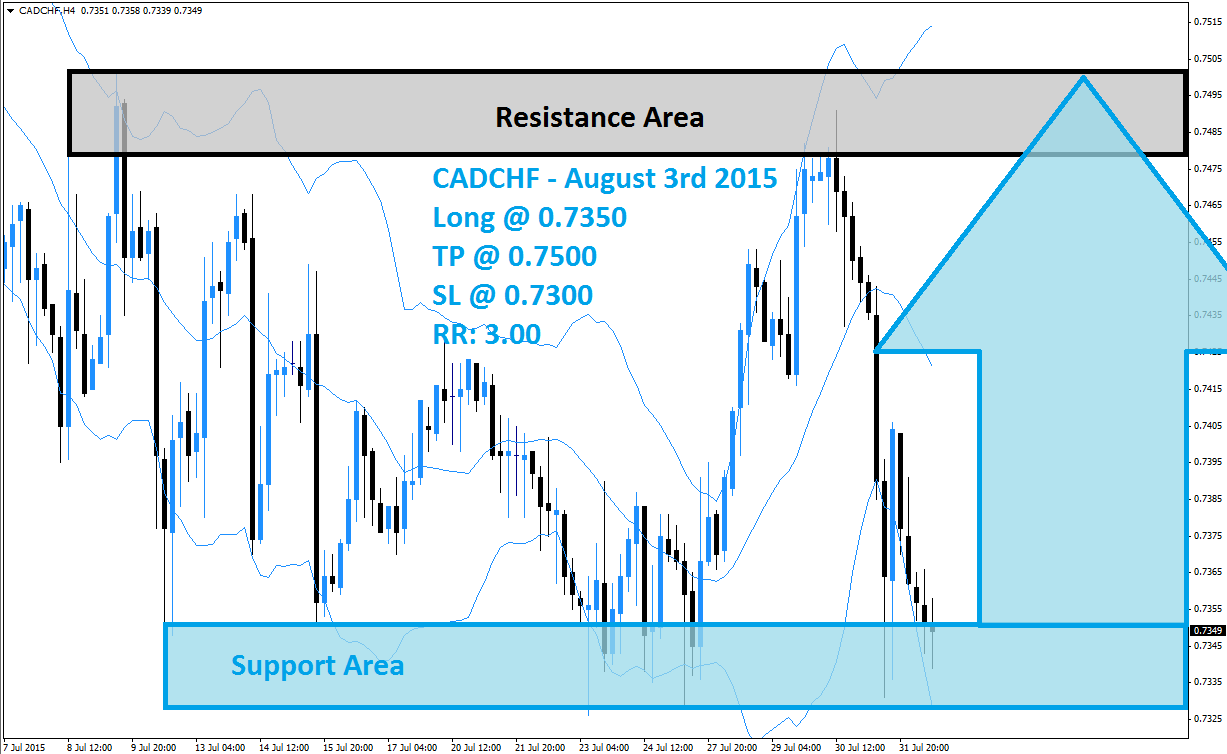
The CADCHF saw a sharp rally followed immediately by a sharp sell-off which took this currency pair back down into its support area, visible in light blue in the above H4 chart, from where the first rally started. The same conditions are present which caused the first rally and the CADCHF is expected to attempt another one which can take this currency pair back into its resistance area which is marked in light grey.
Forex traders are expected to realize floating trading profits and exit their open short positions. This should lead to a string short-covering rally over the next few trading sessions. The upper band of its Bollinger Band indicator is now trading above its resistance area and the lower band is trading below its support area. This shows the sharp increase in volatility. The CADCHF is expected to breakout above the middle band of the Bollinger Band indicator.
Forex traders are advised to seek long entry positions at 0.7350 and below this level which will position them to profit from the expected short-covering rally. Conservative forex traders should wait for a breakout above the middle band of it Bollinger Band indicator before entering their long positions. A take profit target of 0.7500 has been set for a potential trading profit of 150 pips on the H4 Chart. More buy orders are expected after the CADCHF completes its breakout above the middle Bollinger Band.
Forex traders should protect this trade with a stop loss level at 0.7300 for a potential trading loss of 50 pips which will result in a Risk-Reward (RR) ratio of 3.00.
CADCHF
Long @ 0.7350
TP @ 0.7500
SL @ 0.7300
RR: 3.00
 (No Ratings Yet)
Add your review