
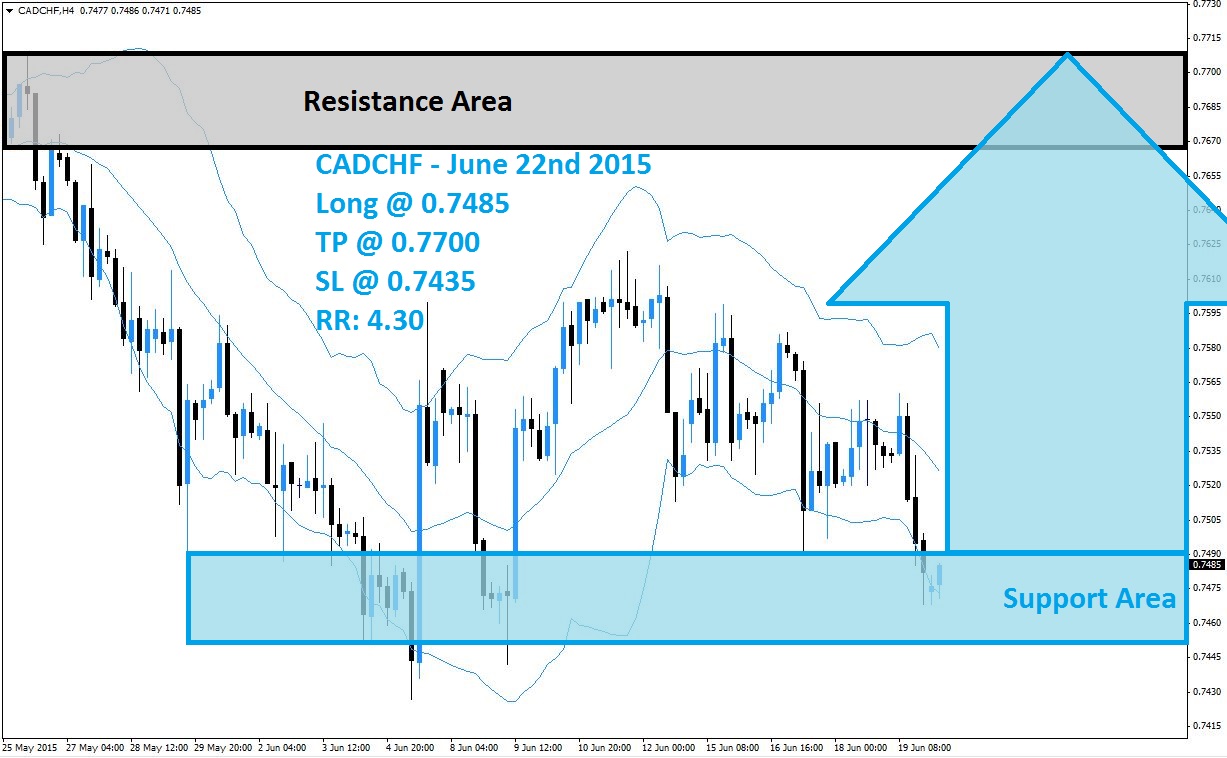
The CADCHF has found support inside of its support area, visible in light blue in the above H4 chart, after a rally fell short of its resistance area which is visible in light grey. After its sell-off which took this currency pair from resistance to support a very bullish H4 candlestick formed which was quickly reversed before a small rally unfolded. The CADCHF was unable to sustain this rally and has retraced its gains.
The Bollinger Band Indicator has support the sell-off and all three Bollinger Bands are currently sloping to the downside. Forex traders can expected a sideways trend to follow which would give this lagging indicator time to catch up with price action. Forex traders are expected to realize floating trading profits inside of a strong support area which will result in a short-covering rally. An ascending support level is providing the finial buy signal.
Forex traders are advised to seek out long positions at 0.7485 and below in this currency pair in order to profit from the short-covering rally. Conservative traders are advised to wait for a breakout above the middle band of its Bollinger Band indicator. A take profit target of 0.7700 has been set for a potential trading profit of 215 pips on the H4 Chart. More buy orders are expected once the CADCHF trades above the middle band of its Bollinger Band indicator.
Forex traders should protect this trade with a stop loss level at 0.7435 for a potential trading loss of 50 pips which will result in a Risk-Reward (RR) ratio of 4.30.
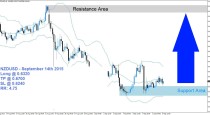
CADCHF
Long @ 0.7485
TP @ 0.7700
SL @ 0.7435
RR: 4.30
 (No Ratings Yet)
Add your review