
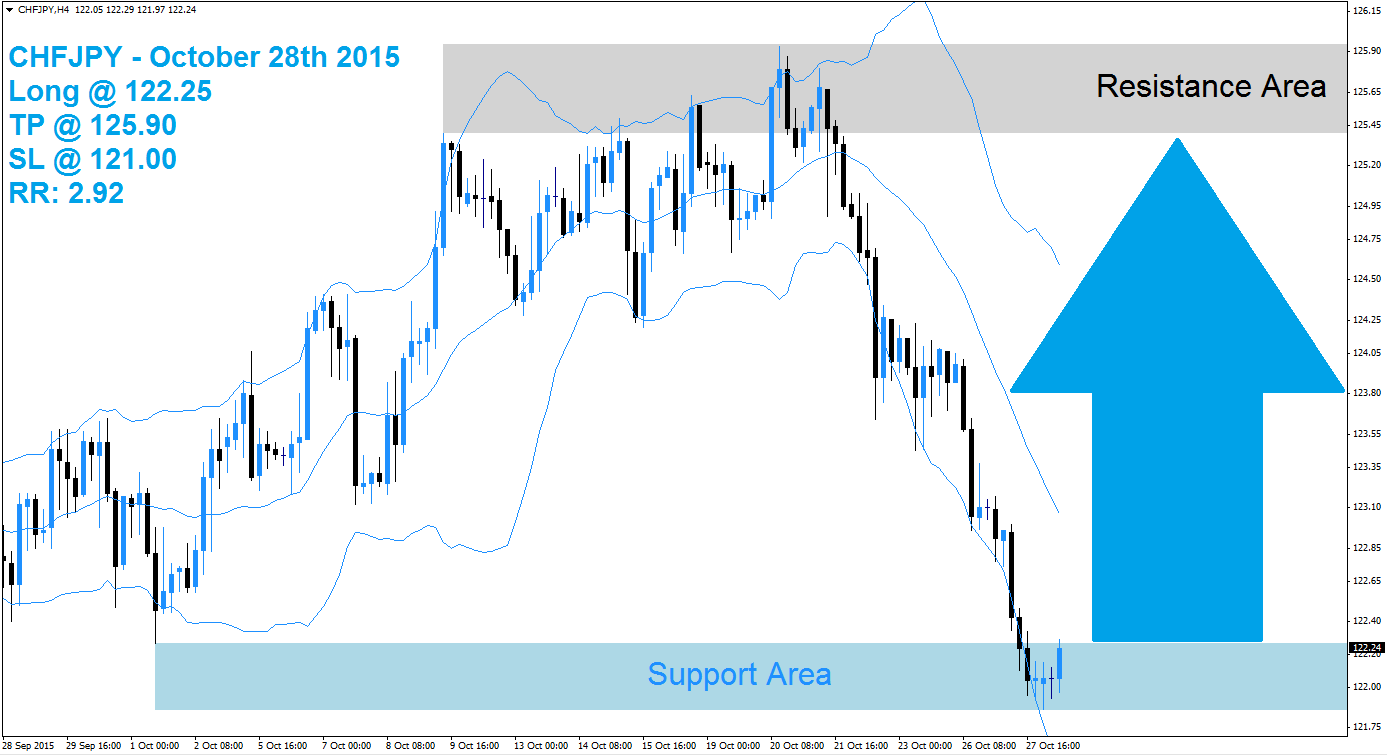
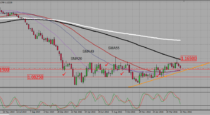
The CHFJPY sold off into its support area which is marked in light blue in the above H4 chart. The Bollinger Band indicator has confirmed the sell-off and plunged together with price action. The lower band broke down below the support area and the middle band as well as upper band are sloping to the downside. The CHFJPY is trading between the lower band and the middle band of the Bollinger Band indicator.
A breakout above the middle band will change the trend as forex traders are expected to take profits after the strong sell-off. This will lead to a short-covering rally as short positions will be closed in order to book floating profits. A breakout above the middle band will add new net long positions and the CHFJPY is expected to rally back to its resistance area visible in light grey in the above chart. The risk to the downside is currently eliminated.
Forex traders are advised to seek long positions at 122.25 and below this level in order to take advantage from the expected short-covering rally. Conservative forex traders should wait for a breakout above the middle band of it Bollinger Band indicator before entering their long positions. A take profit target of 125.90 has been set for a potential trading profit of 365 pips on the H4 Chart. More buy orders are expected after the CHFJPY completes its breakout above the middle Bollinger Band.
Forex traders should protect this trade with a stop loss level at 121.00 for a potential trading loss of 125pips which will result in a Risk-Reward (RR) ratio of 2.92.
CHFJPY
Long @ 122.25
TP @ 125.90
SL @ 121.00
RR: 2.92
Would you like receive more such signals?
($9 per month)
 (No Ratings Yet)
Add your review