
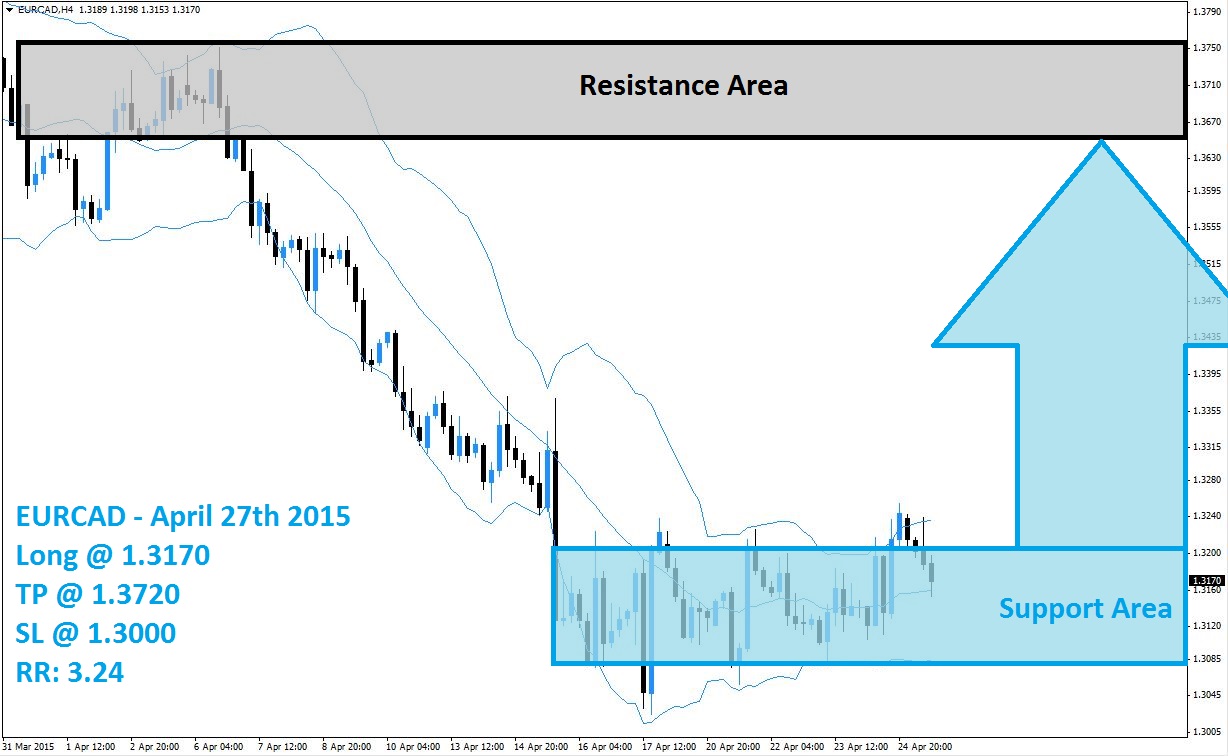
The EURCAD endured a sell-off after it failed to breakout above its resistance area which is visible in light grey in the above H4 chart. After this currency pair broke down below its middle Bollinger Band the sell-off gathered momentum and price action remained contained between the lower Bollinger Band and the middle Bollinger Band. The sell-off took the EURCAD into its support area, visible in light blue, and downward pressure started to decrease as the Bollinger Band indicator started to flatten.
A sideway trend formed and the EURCAD started to trade inside of its support area. During the sideways trend this currency pair managed to set a series of higher lows which allowed the lower Bollinger Band to slope upwards. This has move the middle Bollinger Band as well as the upper Bollinger Band as well and now this indicator has started to provide upward momentum for the EURCAD which could lead to a short covering rally as forex traders will realize floating trading profits and close short positions.
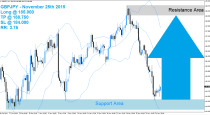
Forex traders are advised to position their forex portfolios with buy orders in this currency pair in order to profit once the EURCAD starts its rally. Long positions at 1.3170 or below are recommended with a take profit target of 1.3720 for a potential trading profit of 550 pips on the H4 Chart. A breakout above the support area could be met with new buy orders on top of the short-covering rally which will accelerate the advance.
Forex traders should protect this trade with a stop loss level at 1.3000 for a potential trading loss of 170 pips which will result in a Risk-Reward (RR) ratio of 3.24.
EURCAD
Long @ 1.3170
TP @ 1.3720
SL @ 1.3000
RR: 3.24
 (No Ratings Yet)
Add your review