
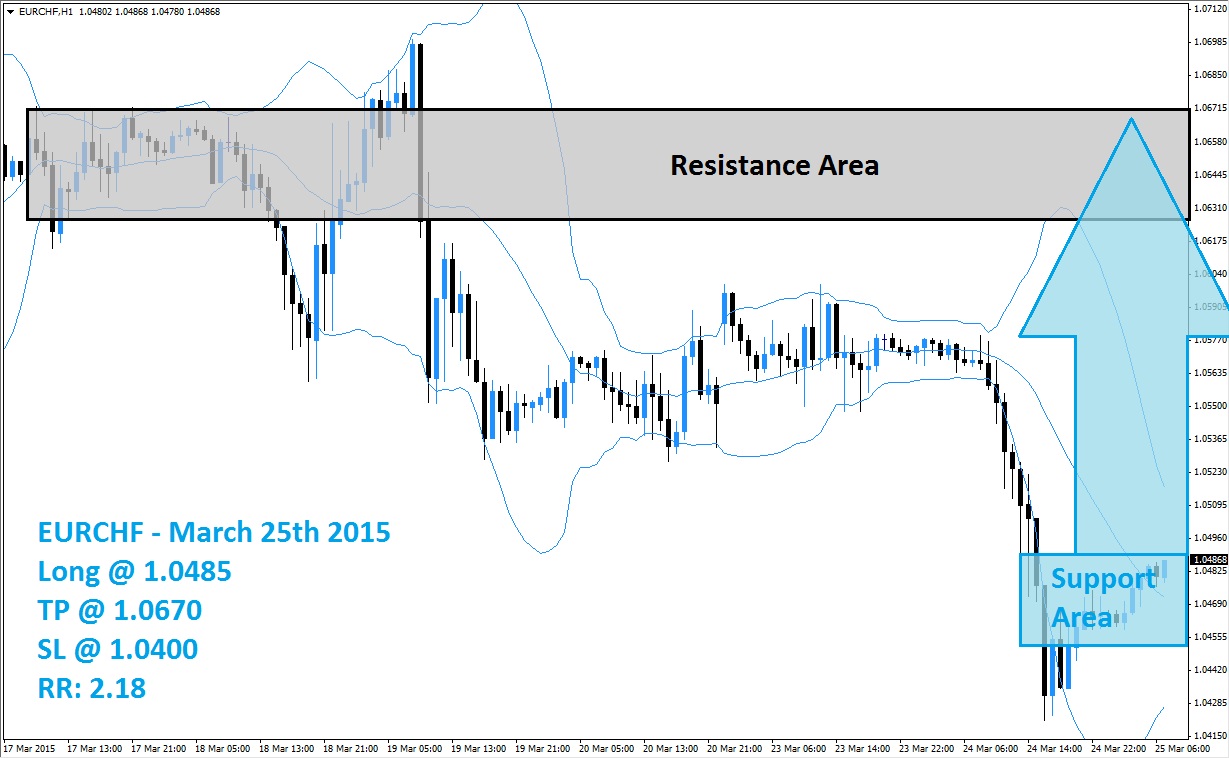
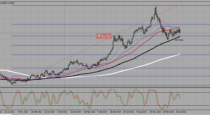
The EURCHF was caught in a correction after a false breakout above its resistance area, marked in grey in the above chart, was quickly reversed. Selling pressure was strong enough to result in a breakdown below the resistance area as well as the middle band of its Bollinger Band indicator which resulted in additional selling. A brief sideways trend developed as the Bollinger Bands flattened before a new wave of sell orders push the EURCHF further to the downside.
The steep sell-off resulted in a false breakdown below support area, marked in light blue in the above chart, and a short-covering rally took the EURCHF back inside of this support area. The upward momentum was strong enough to push this currency pair above the middle band of its Bollinger Band indicator which further added to upward momentum. A breakout above the support area is expected to invite new net long positions as forex traders continue to realize floating trading profits.
As the EURCHF is approaching breakout territory forex traders are recommended to look out for attractive long positons at 1.0485 and below. This will allow forex traders to earn from the expected move. A take profit target of 1.0670 is recommended for a potential trading profit of 185 pips on the H1 Chart. Any dip lower form current levels should be taken as an improved entry opportunity into this long trade as the middle band of the Bollinger Band indicator is expected to prevent further downside.
Forex traders should protect this trade with a stop loss level at 1.0400 for a potential trading loss of 85 pips which will result in a Risk-Reward (RR) ratio of 2.18.
EURCHF
Long @ 1.0485
TP @ 1.0670
SL @ 1.0400
RR: 2.18
 (No Ratings Yet)
Add your review