
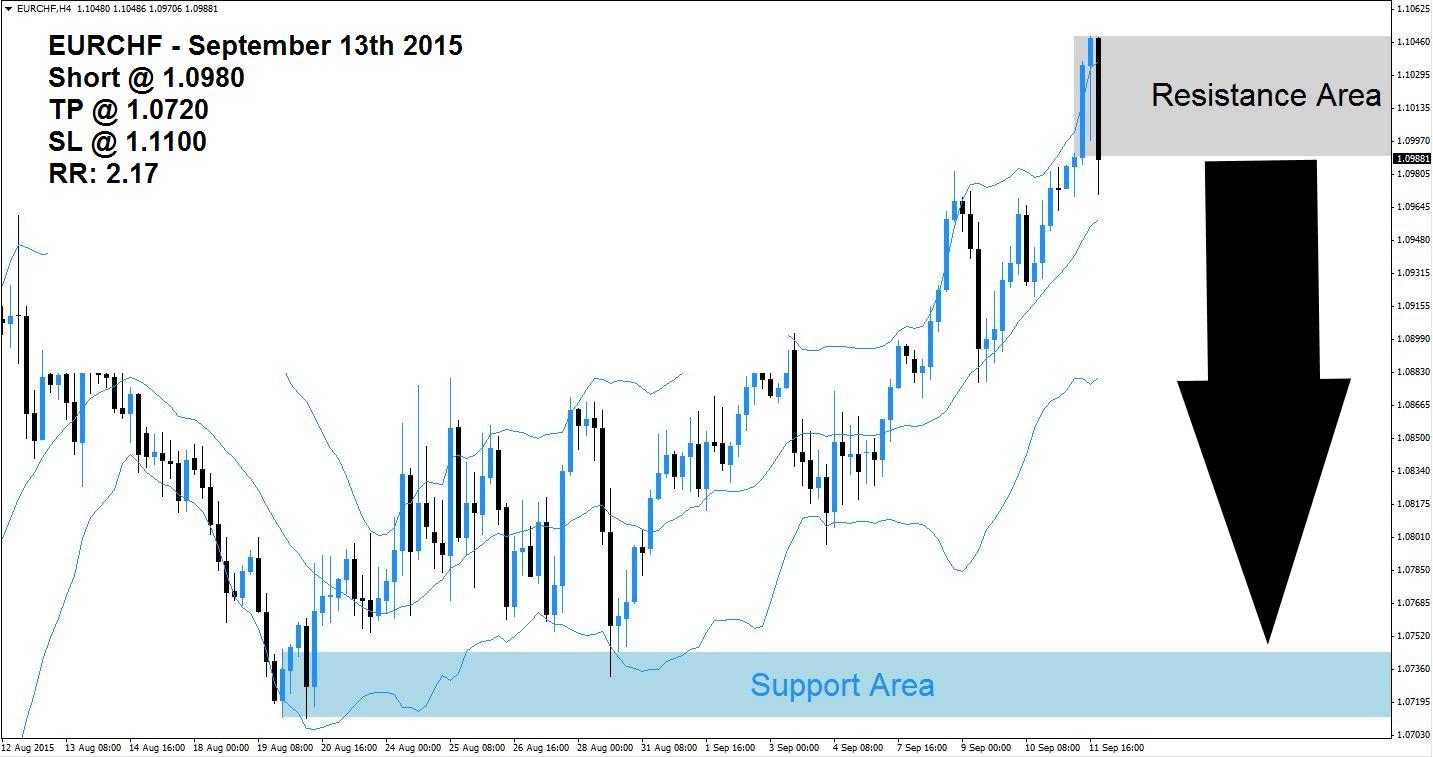
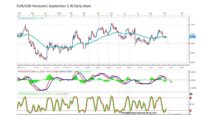
The EURCHF has started to reverse its strong rally which took this currency pair from its support area, marked in light blue in the above H4 chart, to its resistance area which is visible in light grey. The latest H4 candlestick shows a strong bearish reversal which is likely to result in more downside for this currency pair. The lower band of the Bollinger Band indicator started to move sideways while the middle band and the upper band continue to slope to the upside.
Despite the bearish candlestick, price action continues to trade between the middle band and the upper band of the Bollinger Band indicator. Forex traders may opt to realize floating trading profits by exiting their existing long positions which will result in a profit taking sell-off. A breakdown below the middle band is expected to invite a new wave of sell orders which can further increase downward potential for the EURCHF currency pair.
Forex traders are recommended to seek short positions at 1.0980 and above in order to profit from the expected profit taking sell-off in this currency pair. Conservative forex traders should wait for price action to break down below the middle band of its Bollinger Band Indicator which will increase selling pressure. A take profit target of 1.720 has been selected for a potential trading profit of 260 pips. More sell-orders are expected below the middle band of the Bollinger Band indicator.
Forex traders should protect this trade with a stop loss level at 1.1100 for a potential trading loss of 120 pips which will result in a Risk-Reward (RR) ratio of 2.17.
EURCHF
Short @ 1.0980
TP @ 1.0720
SL @ 1.1100
RR: 2.17
 (No Ratings Yet)
Add your review