
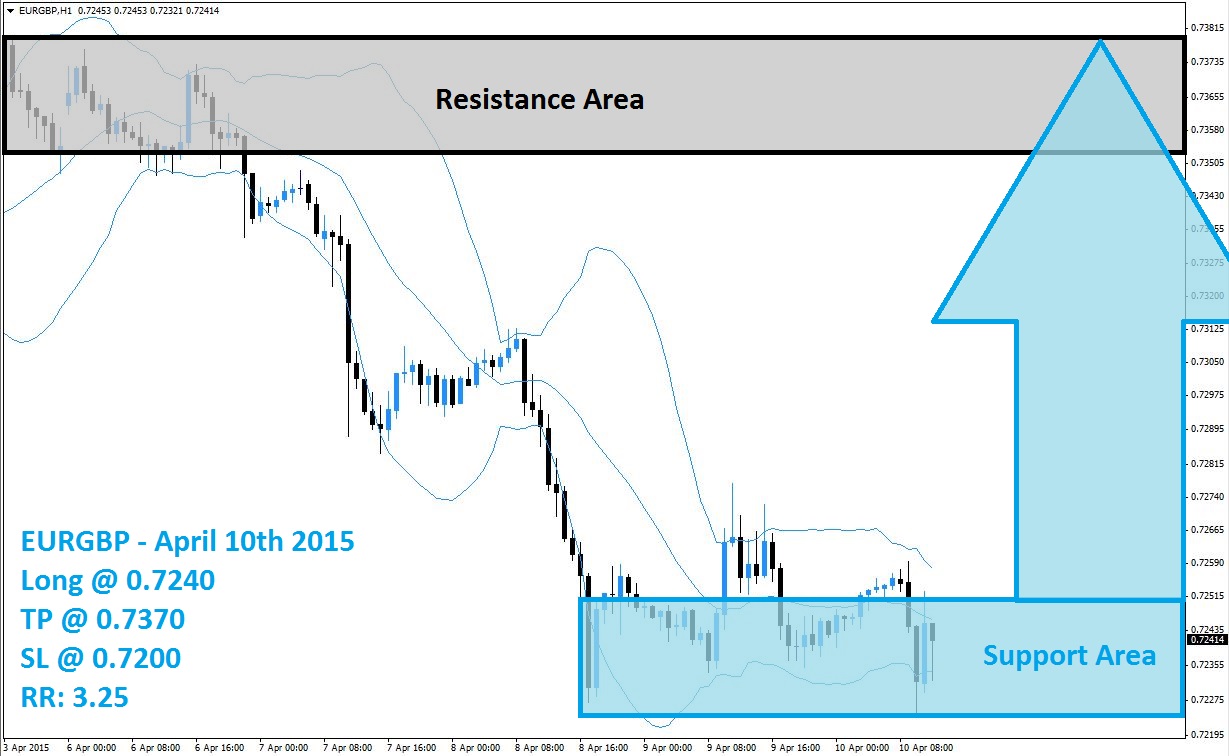
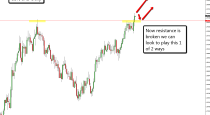
The EURGBP sold-off drastically as the resistance area, visible in light grey in the above H1 chart, successfully prevented a breakout. As the EURGBP started to trade sideways inside of its resistance area the uptrend lost momentum and became vulnerable for a pullback. After the upper band of the Bollinger Band indicator started to slope downwards enough downward momentum was present to result in a breakdown below its resistance area from where the middle band acted as solid resistance.
After the first leg of the sell-off came to an end the EURGBP move slowly higher until it reached the upper band of its Bollinger Band indicator once again. Fundamental reports prevented a breakout and provided enough reasons for forex traders to sell the EURGBP once again which resulted in a drop down to its support area, visible in light blue, from where the sell-off fizzled out and the EURGBP started to trend sideways once again.
The Bollinger Band indicator has now started a sideways trend of its own and the EURGBP is expected to breakout above its support area and enjoy a short-covering rally. Forex traders are advised to take long positions at 0.7240 and below. A take profit target of 0.7370 is recommended for a potential trading profit of 130 pips on the H1 Chart. A breakout above its support area is expected to result in an increase in buy orders.
Forex traders should protect this trade with a stop loss level at 0.7200 for a potential trading loss of 40 pips which will result in a Risk-Reward (RR) ratio of 3.25.
EURGBP
Long @ 0.7240
TP @ 0.7370
SL @ 0.7200
RR: 3.25
 (No Ratings Yet)
Add your review