
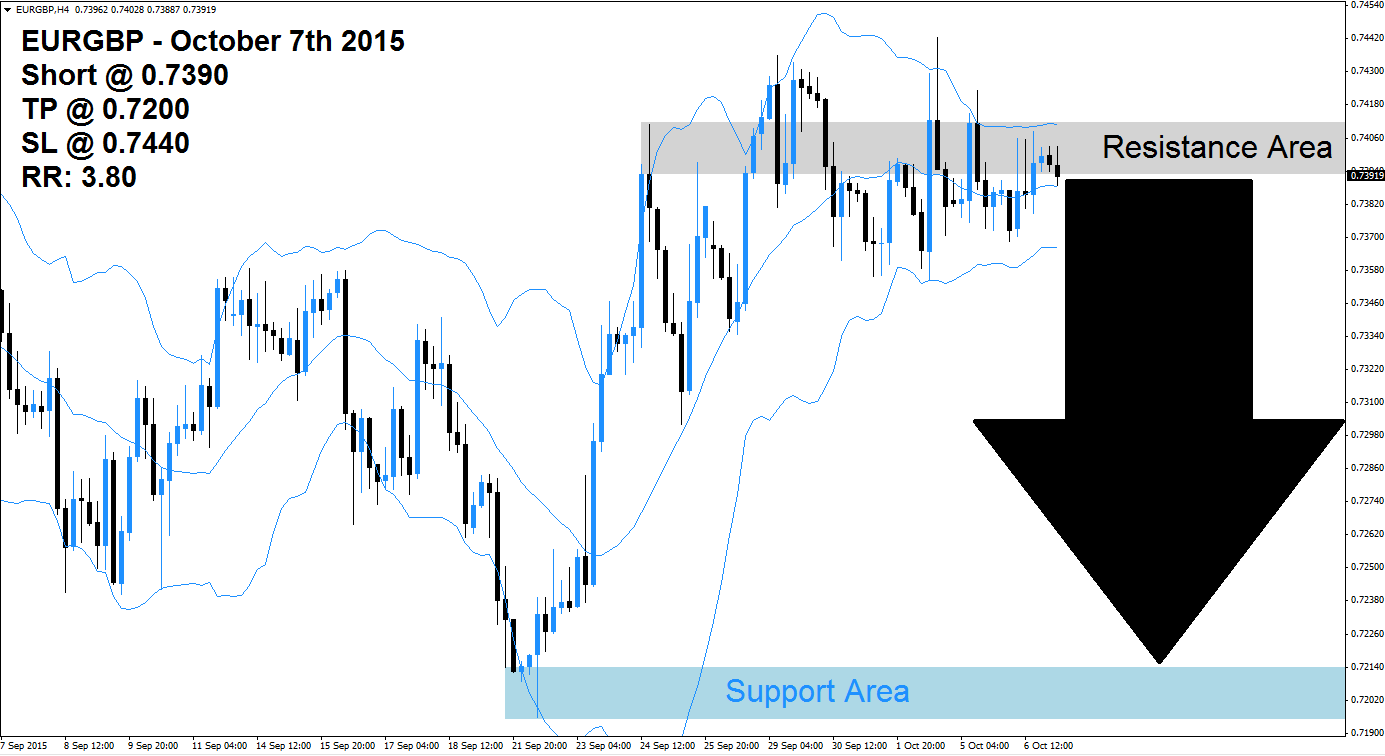
The EURGBP has rallied from its support area, visible in light blue in the above H4 chart, until it reached its horizontal resistance area which is marked in light grey. This currency pair tried to break out above its resistance area, but two breakouts were reversed. The upper band of the Bollinger Band indicator did breakout above the resistance area, but has since reversed and is now trading inside of it. All three bands have started to trend sideways as the rally has ended.
The end of the rally could lead to forex traders opting to realize floating trading profits by closing their long positions. This will lead to a profit taking sell-off. The EURGBP is now trading between the middle band the upper band of the Bollinger Band indicator, but a breakdown below the middle band is expected to lead to a bigger sell-off and the addition of new net short positions in this currency pair which will fuel the expected sell-off.
Forex traders are recommended to seek short positions at 0.7390 and above in order to be well position for the expected profit taking sell-off in this currency pair. Conservative forex traders should wait for price action to break down below the middle band of its Bollinger Band Indicator which will increase selling pressure in the EURGBP. A take profit target of 0.7200 has been selected for a potential trading profit of 190 pips.
Forex traders should protect this trade with a stop loss level at 0.7440 for a potential trading loss of 50 pips which will result in a Risk-Reward (RR) ratio of 3.80.
EURGBP
Short @ 0.7390
TP @ 0.7200
SL @ 0.7440
RR: 3.80
 (No Ratings Yet)
Should hit TP if SL was higher. Nice one.