
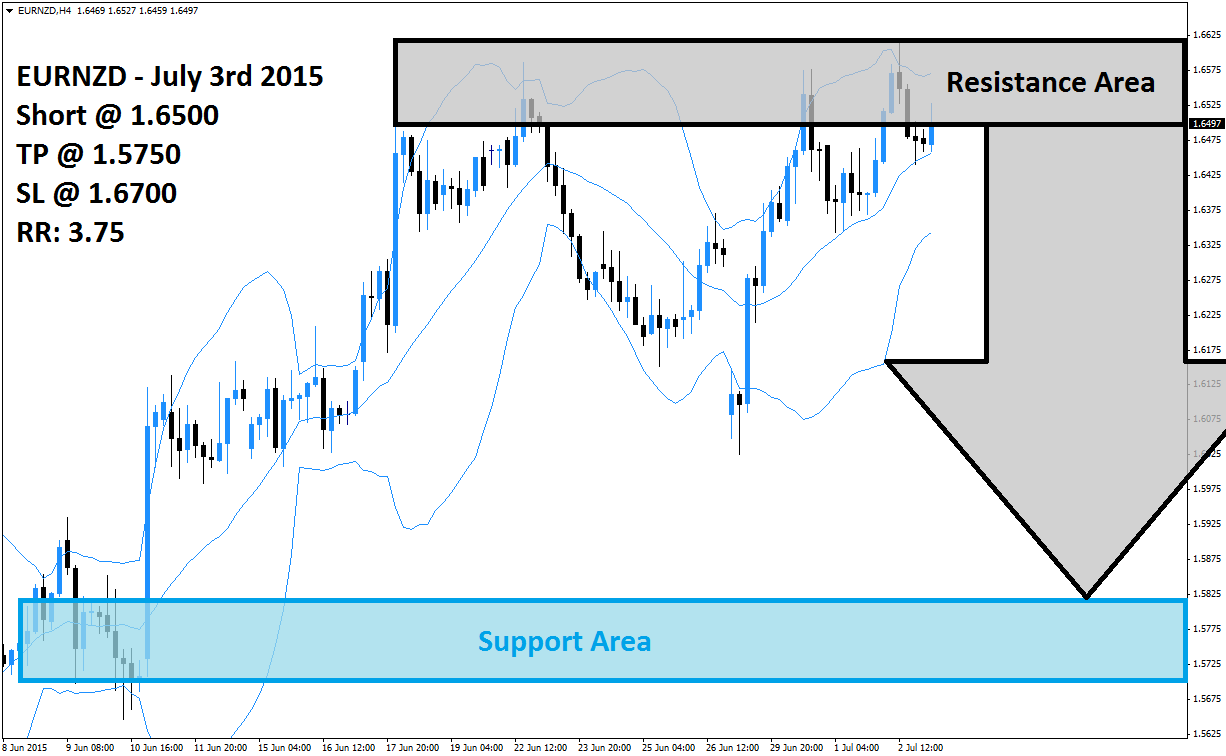
The EURNZD has rallied despite the worries clouding the Euro. This move came on the back of New Zealand Dollar weakness rather than Euro strength and the rally took this currency pair from its support area which is visible in light blue in the above H4 chart to its resistance area which is marked in light grey. Price action did form a double top formation inside of its resistance area which suggests that the next move is likely to be to the downside.
This currency pair could be exposed to a sell-off amid profit taking as forex traders could take the double top formation as a reason to realize floating trading profits. The Bollinger Band Indicator has started to collapse at the top with the upper band sloping to the downside inside of its resistance area. The middle band as well as the lower band is sloping higher with the EURNZD currently trading near its middle band. A breakdown below it could kick-start the expected sell-off.
Forex traders are advised to enter short positions at 1.6500 and above which will position them to profit once the EURNZD enters a sell-off. Conservative forex traders should wait for price action to break down below the middle band of its Bollinger Band Indicator as this would result in a change of momentum to bearish. A take profit target of 1.5750 has been selected for a potential trading profit of 750 pips.
Forex traders should protect this trade with a stop loss level at 1.6700 for a potential trading loss of 200 pips which will result in a Risk-Reward (RR) ratio of 3.75.
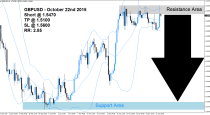
EURNZD
Short @ 1.6500
TP @ 1.5750
SL @ 1.6700
RR: 3.75
 (No Ratings Yet)
Add your review