
EURUSD trading plan.
Watch price action around 1,105. Favor buying above towards 1,14 and 1,17.
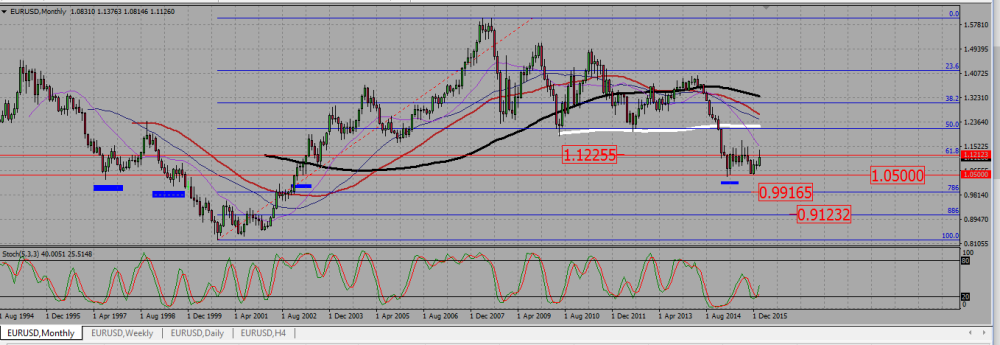
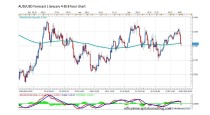
On the monthly chart, the pair has been ranging since March 2015 between 1,05 and roughly 1,125. The current candle is a bullish one, but it looks currently blocked by that resistance around 1,1225. The SMAs suggest a neutral to bearish trend.
EURUSD MONTHLY CHART.
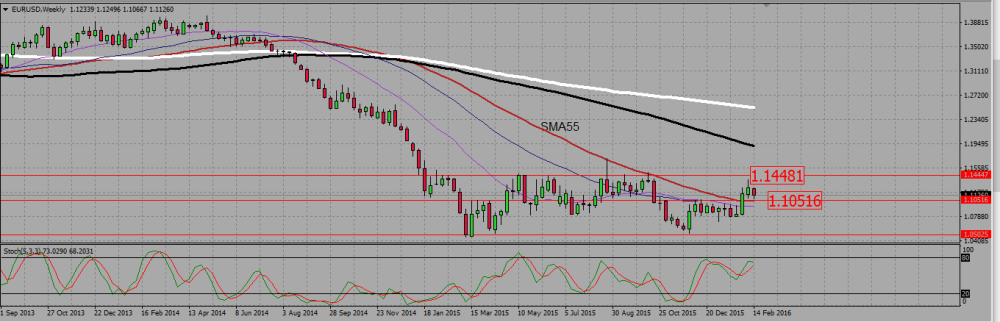
The weekly chart reflects this range, but it also shows the resistance may be located as high as 1,144. Smas are mixed, with long term SMA (200,100,55) pointing down while short term SMAs are flat. There was a bullish move during the two first weeks of February, and it was strong enough to break up the 55 SMA; that SMA twice held the pair as a resistance last year -around 1,17 in August, and then around 1,14 in October-. As it was broken up this year, it is now a support, and above it -roughly 1,105- I will rather look to buy the eurodollar towards 1,144 (the resistance of the range).
EURUSD WEEKLY CHART.
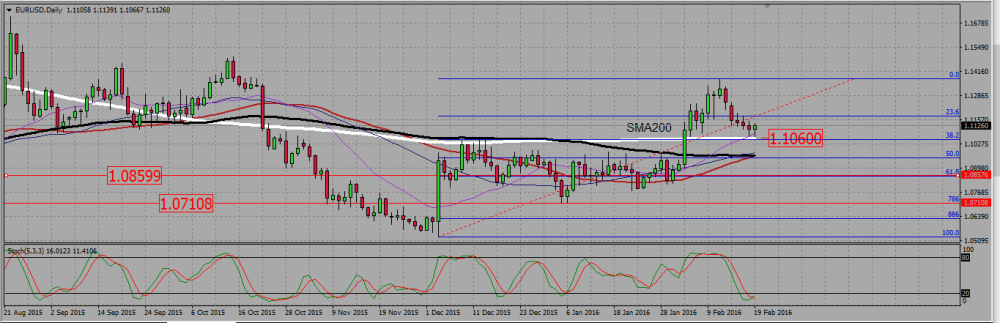
The daily chart is slightly more bullish. The SMAs are slowly pointing up, and we have a hammer on the Friday candle, straight above the 200 SMA, near 1,105. The weekly 55 SMA is also located there, adding to the weight of that support. We also have a double bottom at that level, another bullish sign. Therefore I prefer to buy signals around that level. But should it broke down, I will sell to got back to the supports at 1,085, 1,07, and may be 1,05.
EURUSD DAILY CHART.
2-GBPUSD TRADING PLAN.
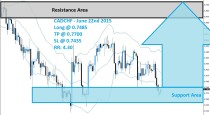
Buy above 1,425 to go to 1,46 and then to 1,49, Sell under it to go to 1,405. The cable has been in an hesitating mode during the London summit, but I expect the agreement between the UK and the EU will allow the pair to really start moving.
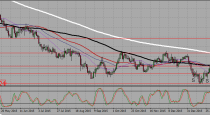
On the monthly chart, the GBPUSD is pretty much hesitating around a 0,786 Fibonacci retracement level located at 1,426. The cable broke it down, then reversed around 1,405 to surged back over that 0,786 fib level again. It now looks like it wants to go down and to retest it as a support. SMAs are rather pointing down. On the bullish side, the next serious resistance seems to be the 61,8 Fibonacci level around 1,49.
 (1 votes, average: 5.00 out of 5)
Add your review