
Expect some bearish consolidation first, but buy signals above 1,115 and hold, gradually adjusting your stops. Sell a break down of 1,115 towards 1,0825.
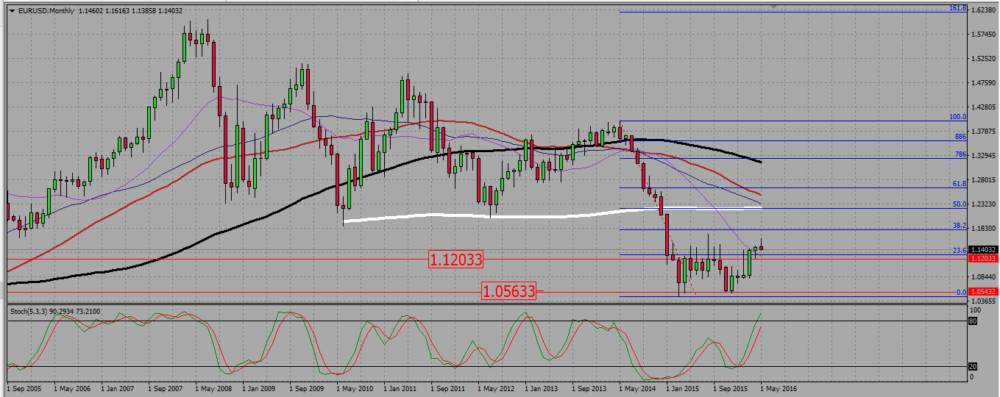
On the monthly chart, the pair recently broke a range resistance near 1,12, but instead of going higher, it produced a tiny candle and now seems to be wishing to go down. But it may also be the euro is just retesting the 1,12 level before rising again.
EURUSD MONTHLY CHART.
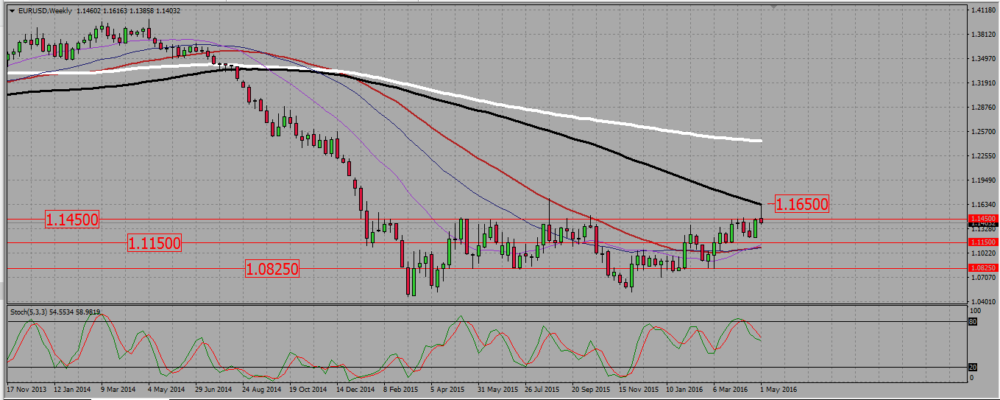
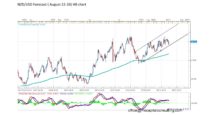
On the weekly chart the pair clearly rejected the 100 SMA resistance around 1,165 with a shooting star candle, and it even broke down an old resistance -now support- at 1,145, standing now around 1,14. That last weekly candle is very significant, and I am expecting the pair to keep going down for the beginning of the week. But I will not sell it at that level because of the daily chart (see below).
EURUSD WEEKLY CHART.
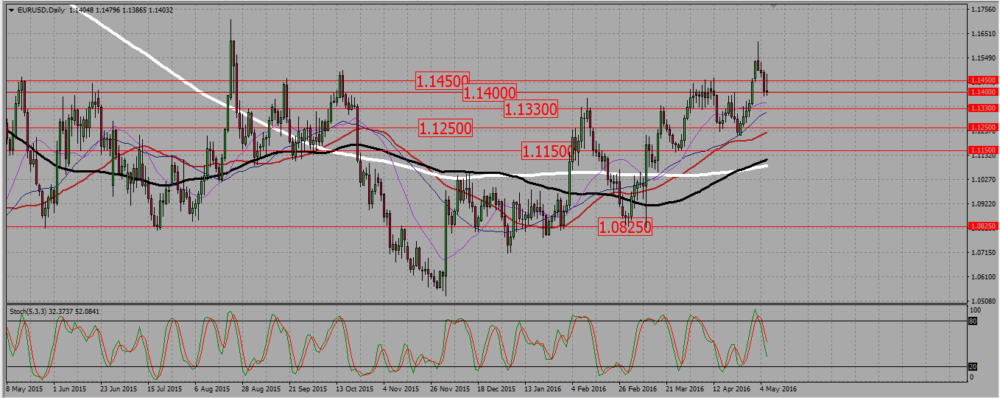
On the daily chart we see a potential bullish trend taking form : the SMAs are starting to point up, and there are several higher highs and higher lows. This is why I do not want to sell the euro, but rather buy any signal near a support (1,14, 1,133, 1,125, 1,115). But under 1,115, I will sell towards 1,0825 and may be 1,05.
EURUSD DAILY CHART.
 (1 votes, average: 5.00 out of 5)
Add your review