
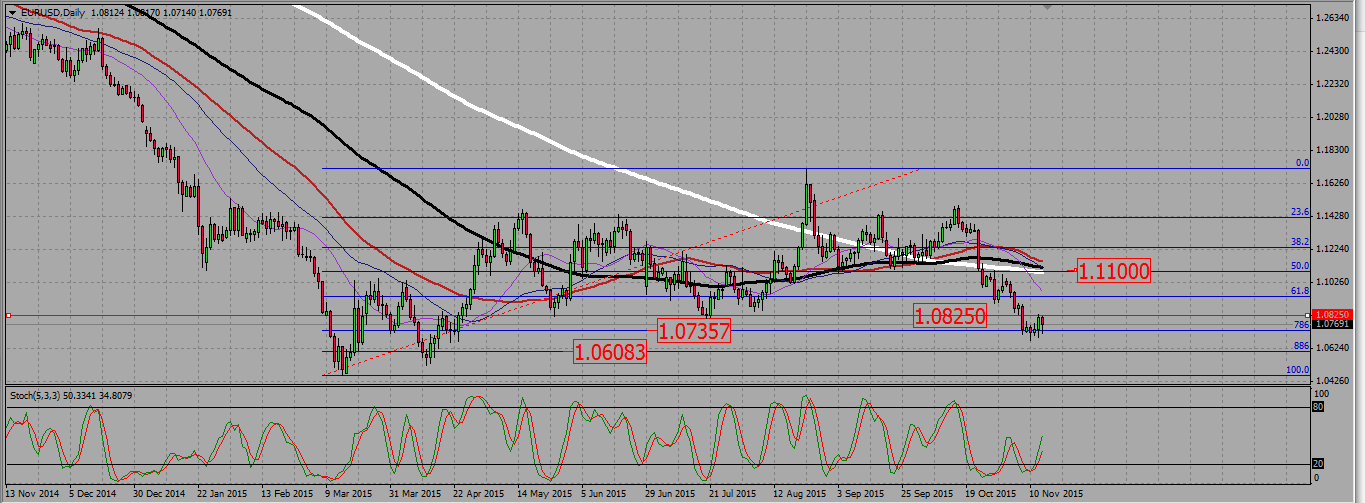
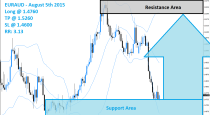
1-EURUSD trading plan.
Watch 1,0825 for a possible counter trend bullish move, but under 1,11 rather look for selling signals, keeping an eye on the 1,08 – 1,055 area as it is a strong support zone.
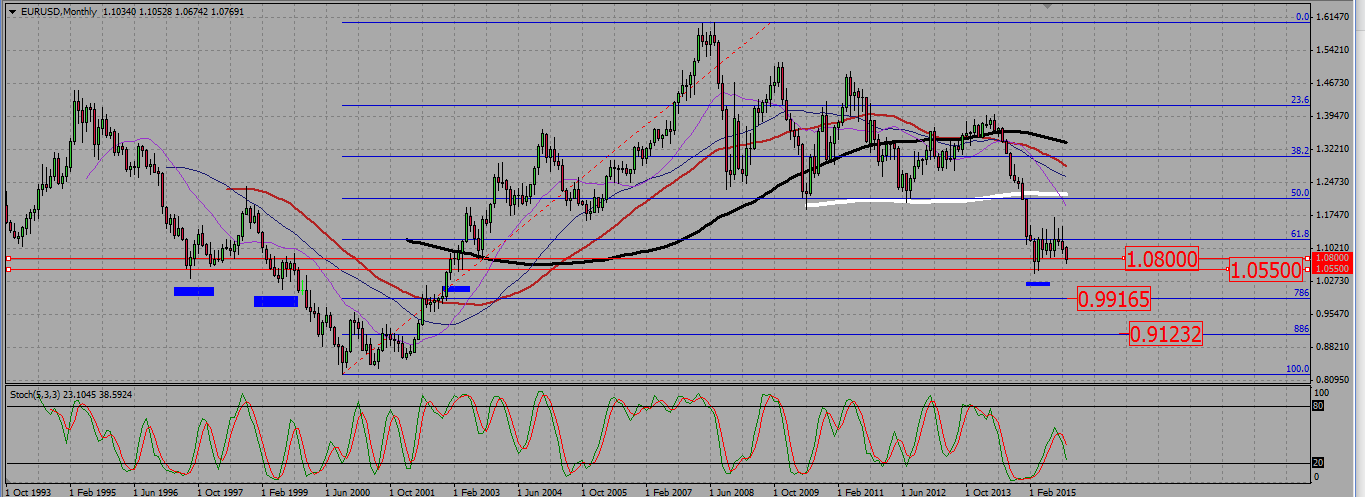
On the monthly chart, the EURO is mainly ranging. Is is now facing a tough, but quite extended support area between 1,08 and 1,05 that held the eurodollar last bearish attempt in March.
EURUSD MONTHLY CHART.
On the weekly chart, there is a bullish spinning top candle, weakly retesting a resistance line around 1,0825. Should that line break up, the way for further bullish consolidation is opened. As it would be a bounce from a monthly support area, a several week long bullish consolidation may happen there.
EURUSD WEEKLY CHART.

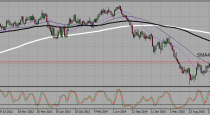
Finally, the daily chart shows an important resistance around 1,11, with both a 50 Fibonacci resistance level and four SMA s -200,100,55,40- converging. As long as we are under that level, I will rather look for selling signals. The most obvious short term supports are the 0,786 and 0,886 Fibonacci support levels around 1,0735 and 1,06. They may be used as partial take profit levels.
EURUSD DAILY CHART.
2-GBPUSD trading plan.
Look for selling signals under 1,525. Should we break up 1,53, start looking for buying signals.
On the monthly chart, the pair broke down a Fibonacci 50 level support, but is slowly climbing back to that level. It is most probably a retest, and I will rather look to sell the cable. A note of caution, however : on that chart GU has been ranging for 5 years now, and that it is rather on the lower side of the range.
GBPUSD MONTHLY CHART.

On the daily chart , a look on the last bullish move, between April and May this year, shows the pair is retesting another 50 Fibonacci level as a resistance around 1,525. This is why I prefer to consider the whole area 1,525-1,53 as a resistance, ad I will look for selling signals in that zone, with final take profit levels slightly above the 0,886 Fibonacci level, around 1,475. But I will be ready to close earlier, for instance around 1,50 or 1,48.
GBPUSD DAILY CHART.

 (1 votes, average: 5.00 out of 5)
Add your review