
1-EURUSD trading plan.
Watch the 1,135 level on the beginning of the week. Sell a consolidation, if any, down to 1,115. Look for buying signals around 1,115, 1,135, and for a possible bullish break out of the 1,145 resistance.
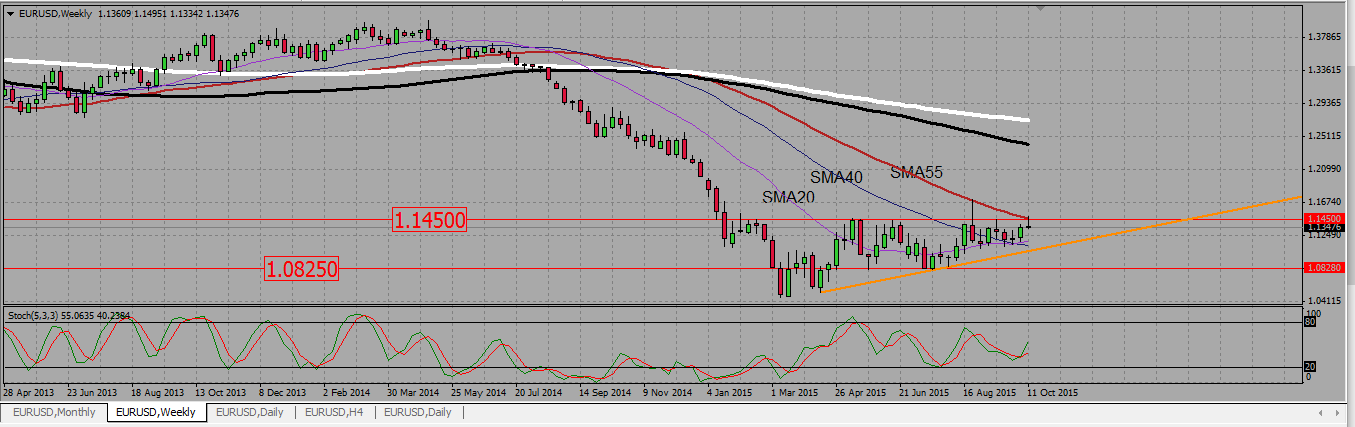
EURUSD has rejected a weekly bullish triangle resistance around 1,145. the rejection candle is a mild one, and although we may see some short term downward move, the pair has been slowly drifting up since March this year. I would rather look to buy signals on supports.
EURUSD WEEKLY CHART.
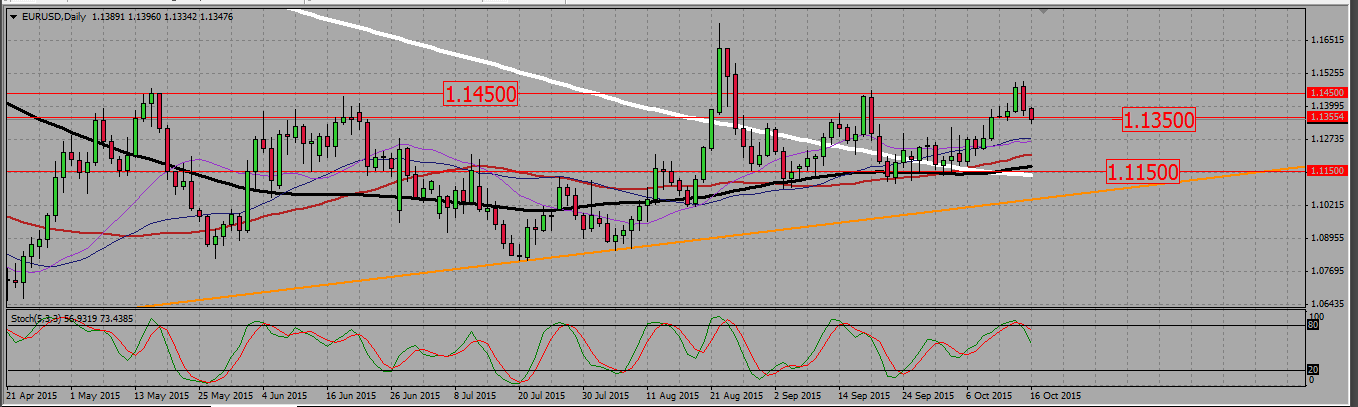
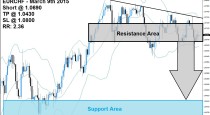
On the daily chart, and after rejecting the 1,145 resistance on Wednesday, the euro gave a dark cloud cover candle on Thursday, and a small bearish candle that landed on a support around 1,135 on Friday; we are in a short term bearish consolidation. The pair may keep going down from that level, and it that case I will consider selling signals to go back to the 1,115 support. But as we saw on the weekly chart, the pair has been slowly rising since March this year, and I rather prefer to buy it.
EURUSD DAILY CHART.
2-GBPUSD trading plan.
Watch 1,5425, 1,535 and 1,5175 for buying signals towards 1,588. Sell signals under 1,5175.
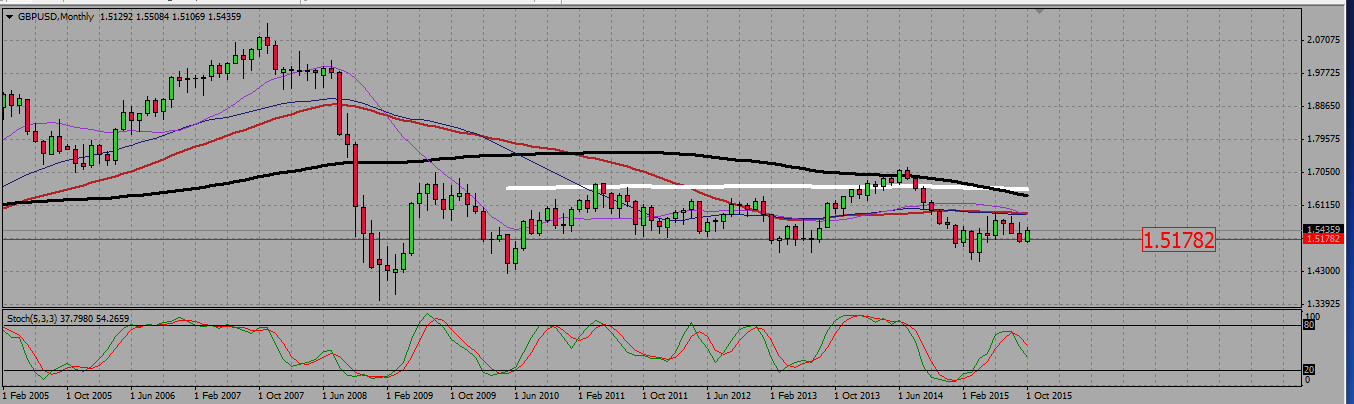
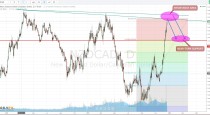
On the monthly chart GBPUSD is at a level where it is used to bounce up. The current monthly candle is already up by 250 pips.
GBPUSD MONTHLY CHART.
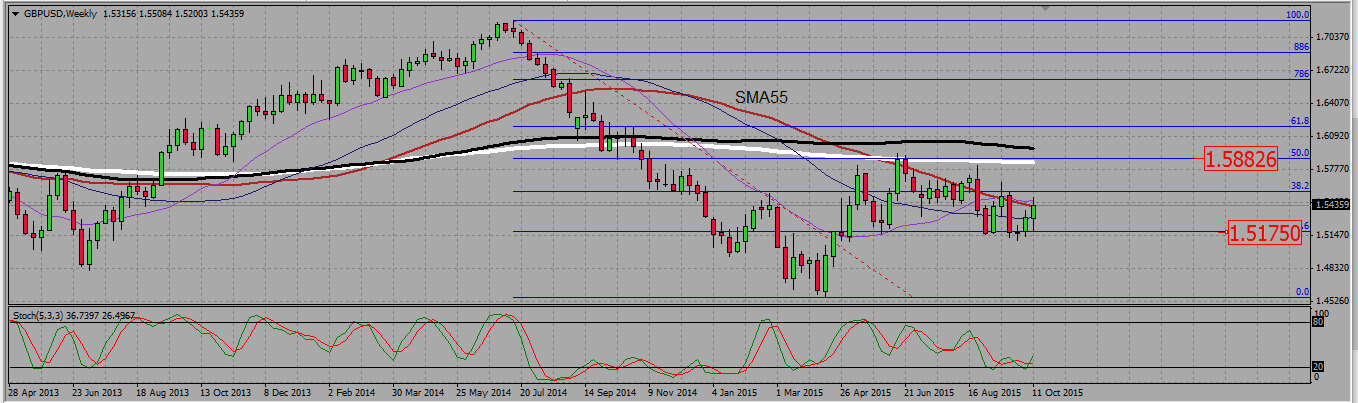
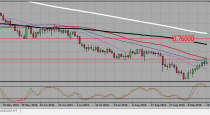
On the weekly chart we see the pair bounced up from a fibo level around 1,5175 and then made two bullish candles. It has been capped by the 55 SMA resistance around 1,5425, but generally seems to be consolidating up. The next fibo resistance is the 50 one around 1,588, and that will be my take profit level on any long trade.
GBPUSD WEEKLY CHART.
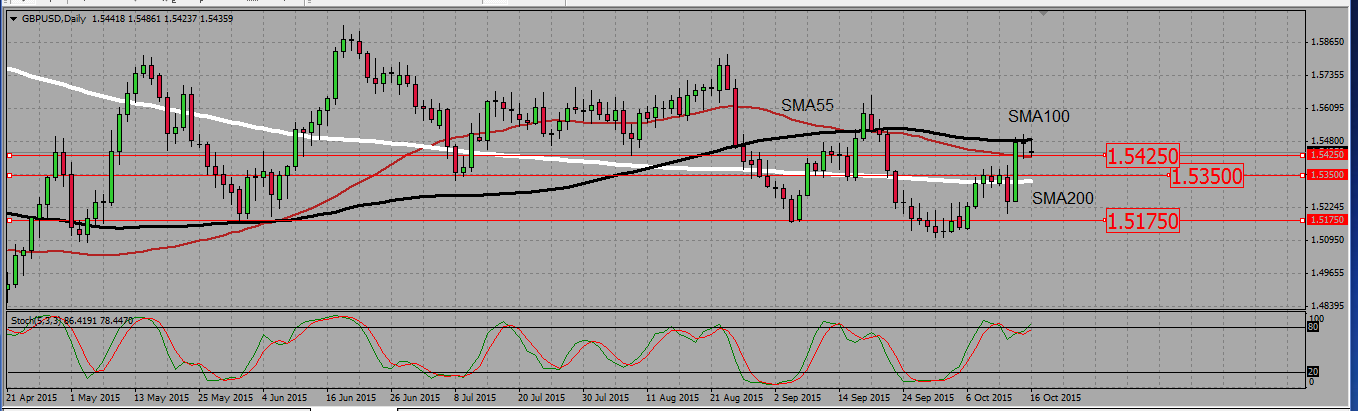
On the daily chart we had a very strong bullish candle on Wednesday, followed by two weak bearish consolidation candles on thursday and Friday. The pair seems to have retested and rejected the 55 SMA as a support around 1,5425, and this is the first level I will use to look for buying signals in case of a retest. The second support level to watch is the 1,535 one, where the 200 SMA is roughly also located. The last level I will use as a support is the 1,5175 one. A breakdown of that level will end my bullish bias on that pair.
GBPUSD DAILY CHART.
 (No Ratings Yet)

Add your review