
1-EURUSD trading plan.
Watch 1,115 and 1,11 for bullish reversal. Sell confirmed bearish breakout towards 1,08.
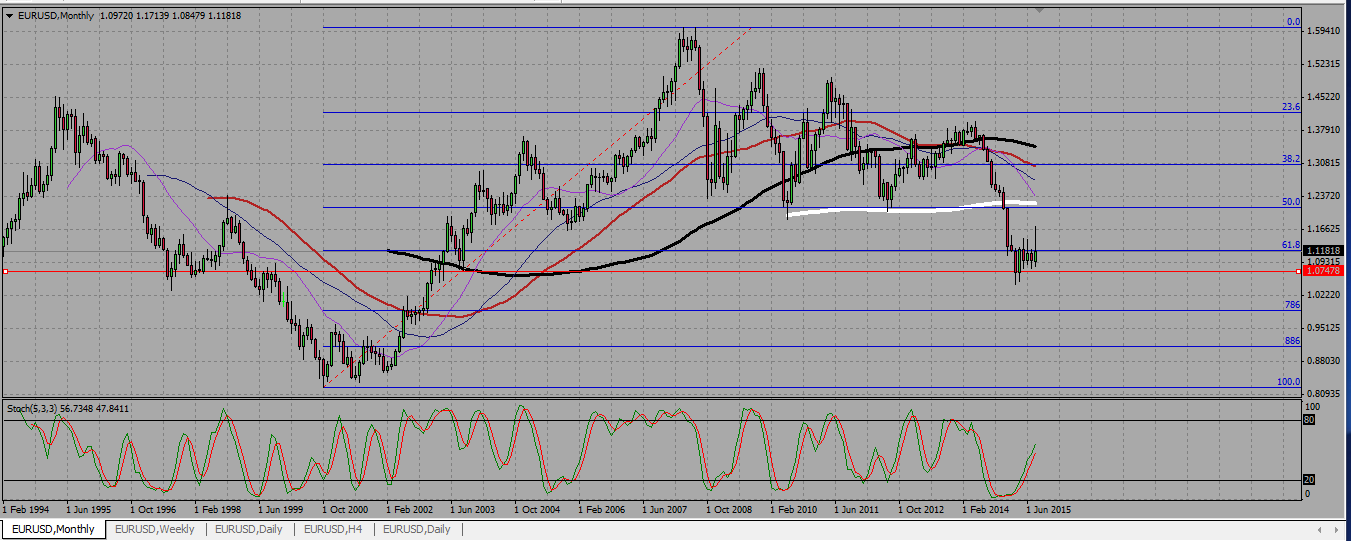
The monthly chart shows EURUSD standing right on a fibo line around 1,12. For the last four months, the pair has been consistently testing that level as a resistance.
EURUSD MONTHLY CHART.
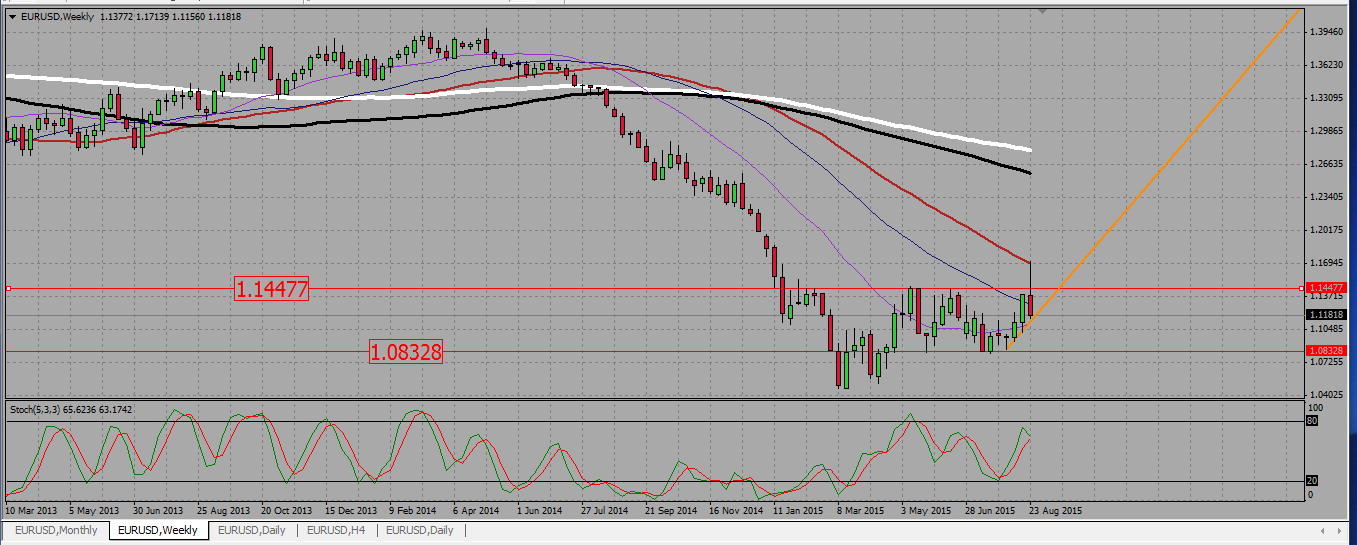
On the weekly chart we see the pair in a range,with a resistance around 1,145, and a support line at 1,08. furthermore, the last candle shows a ffailed attempt at that 1,12 resistance level.The pair may go back to the range support at 1,08, but please notice the support trend line located within the range. It may act as another support.
EURUSD WEEKLY CHART.
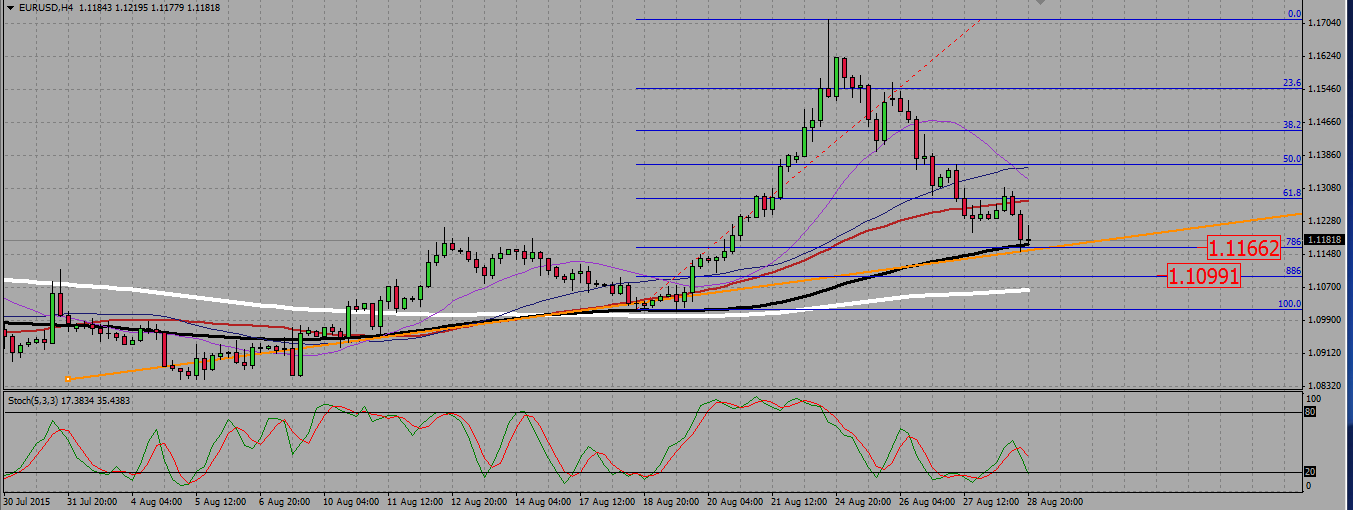
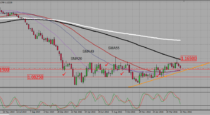
Finally, the H4 chart shows us the eurodollar under a bearish consolidation, but reaching two significant support levels, the first= around 1,115 with a 0,786 fib line, the H4 100 SMA, and an horizontal support line, and the second around 1,11 with the 0,886 fib line, the H4 200 SMA, and the support line we noticed on the weekly chart. I will definitely look for long signals around those two levels. In case 1,11 is broken down, and as long as we stay under it, I will rather sell signals with a take profit level located at 1,08 -the weekly range support-.
EURUSD H4 CHART.
2-GBPUSD trading plan.
The pair looks like it wants to be a bear, but technically it is still in a range, and just above a few supports. I will watch the 1,535 – 1,525 area to look for long signals towards 1,5525, or I will sell a confirmed break down of 1,52.
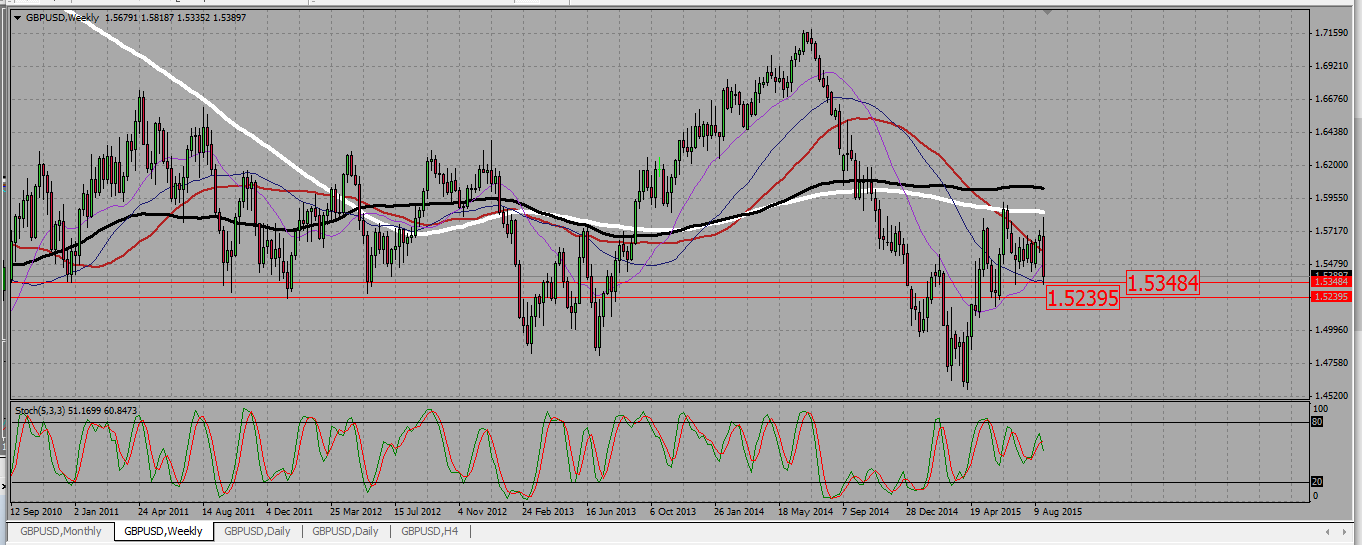
On the weekly chart we see the pair was trending down since 2014, but it reversed on April this year, to start again a funny range on May. The last candle is however a strong bearish engulfing one, and further bearish action cannot be discarded.
GBPUSD WEEKLY CHART.
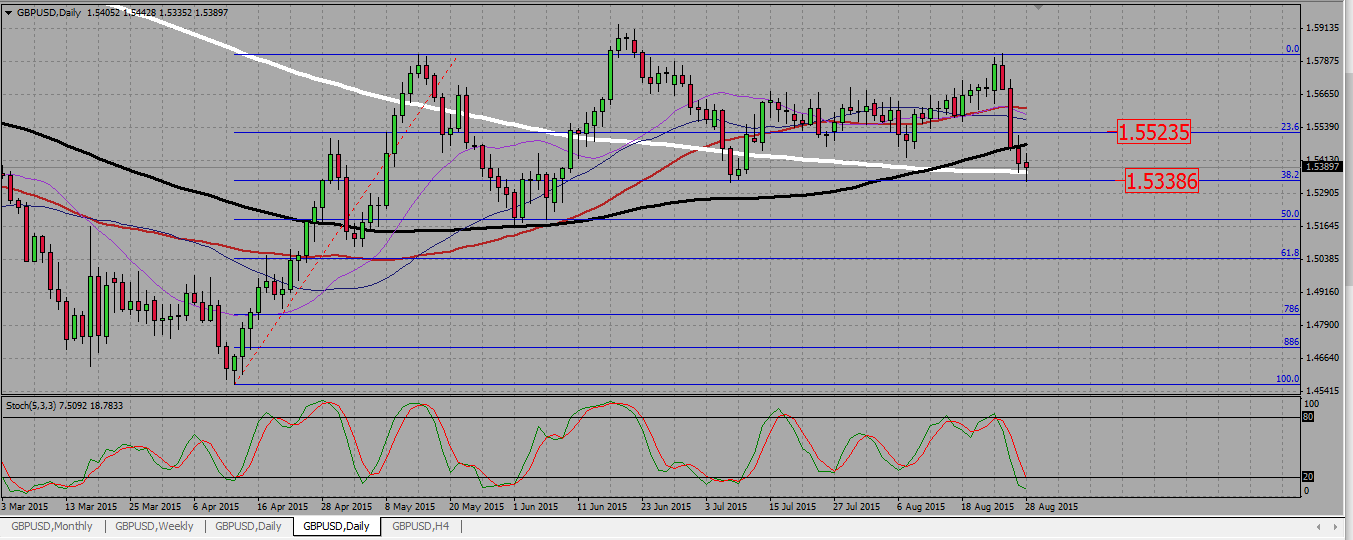
On the daily chart we see a bearish move, and the pair even managed to break a support around 1,5525; but here again we landed on the daily 200 SMA around 1,535, and it seems we are now rather in a ranging situation. We also noticed a fib line that acted as a support around 1,533. I will look for reversal at that level -1,533- to go back and retest the 1,5525 resistance.
GBPUSD DAILY CHART.
 (No Ratings Yet)
Add your review