
1-EURUSD trading plan.
Buy dips above 1,105, aiming at 1,14 and 1,17.
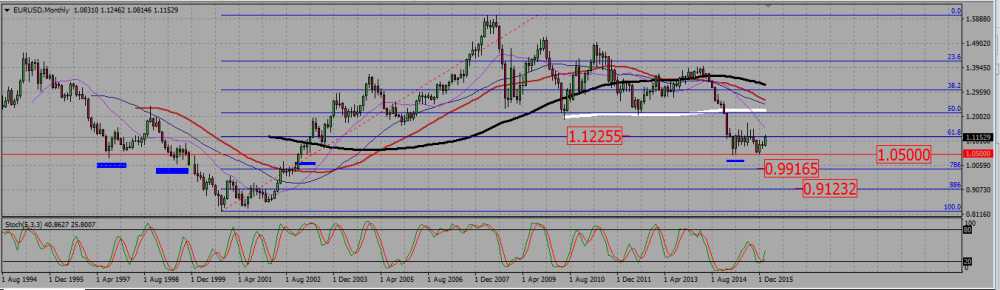
On the monthly chart, we are rather in a down trend, but the pair is rising to test a resistance level located slightly above 1,12.
EURUSD MONTHLY CHART.
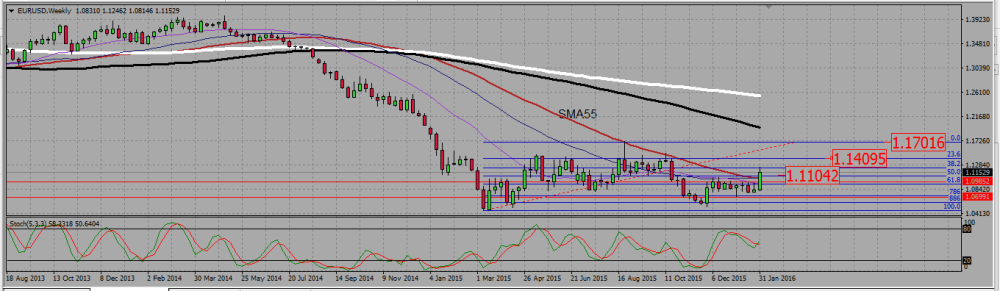
On the weekly chart we are in a consolidating mode, but we see a very strong bullish engulfing candle, breaking a resistance around 1,09, the weekly SMA55, and two Fibonacci resistance levels,the 61,8 and a the 50. The 55 SMA, that was a very significant resistance, stands now support around 1,11, where is also located the 50 Fibonacci retracement level. As long as we stay above those two supports, I prefer to buy pull backs,aiming at the 23,6 Fibonacci level around 1,14 and then the last weekly high around 1,17.
EURUSD WEEKLY CHART.
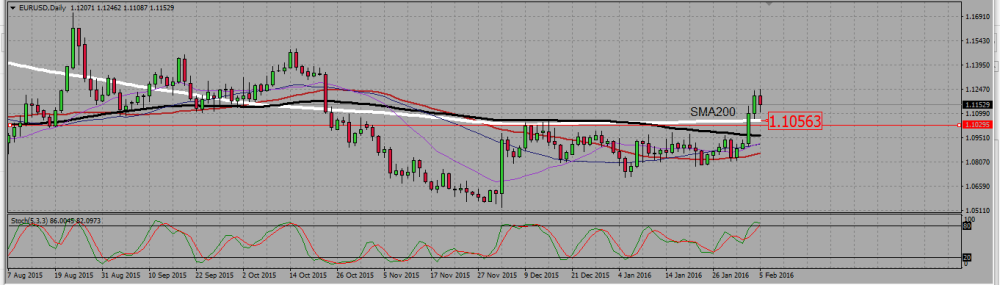
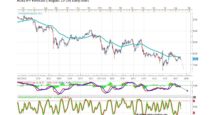
On the daily chart, it seems we may allow for pull backs to go as low as 1,105, as the 200 SMA seems to offer the eurodollar some support there. A bearish break out of that SMA would however end my bullish bias on that pair.
EURUSD DAILY CHART.
2-GBPUSD trading plan.
Watch 1,46 for a bearish reversal or a bullish break out. Look for bullish reversals down to 1,405. Do not short between 1,44 and 1,405.
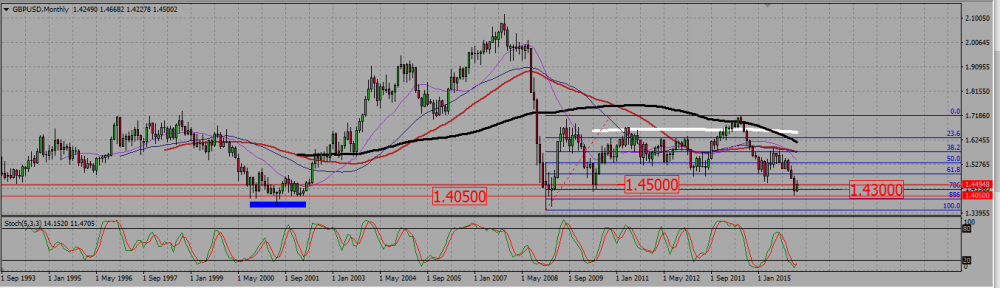
On the monthly chart, we see the SMAs looking more and more bearish. On the other side we are near a strong support zone -1,35 to 1,40- that has not been broken for more than 20 years. The pair made a move down in January, but found support at a 0,786 Fibonacci retracement level around 1,43 and seems now to be bouncing up. There is an up wick on theFebruary candle, meaning this bounce is for the moment blocked somewhere by a resistance.
GBPUSD MONTHLY CHART.
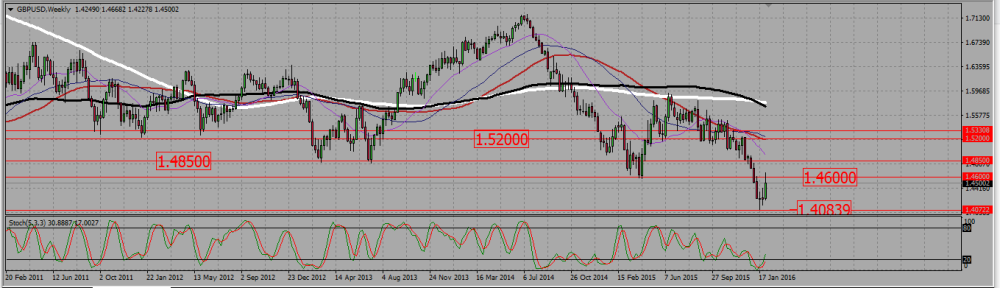
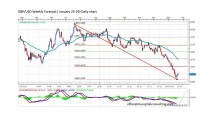
On the weekly chart, we are rather in a down trend, but the pair rejected a support around 1,4075, and then went up to be blocked by a resistance around 1,46.
GBPUSD WEEKLY CHART.
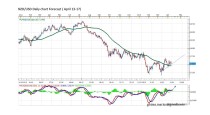
On the daily chart, we see a rather convincing rejection of the 1,46 resistance, and the SMAs shows we are in a downtrend. There is an obvious support around 1,44 1,436, and the whole areas under that is support down to 1,423. As we saw on the monthly chart that this is the beginning of an even larger support zone, I will not sell the cable between 1,436 and 1,405, and will rather buy any signal in that area. A bearish break out of 1,405 would make me re assert the situation.
GBPUSD DAILY CHART.

3-USDCAD trading plan.
Buy above 1,38 and then 1,40 to resume the bullish trend. Sell bearish break out of 1,38 to go back to 1,3375 – 1,34
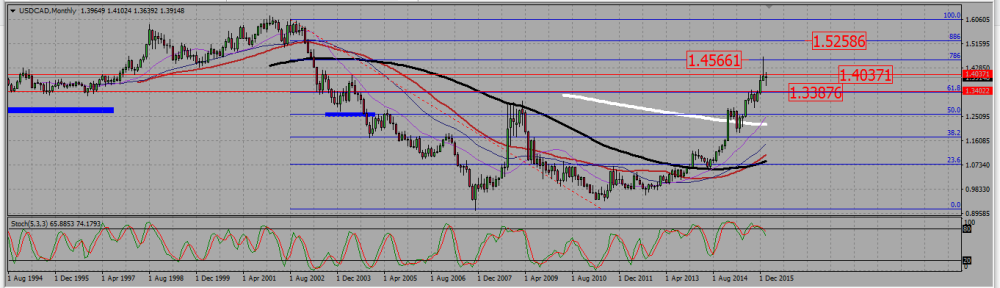
On the monthly chart the pair is turning bullish but rejected a 0,786 Fibonacci level resistance around 1,455. It then broke down a minor support level around 1,0403, but seems to be willing to test it back as a resistance.
USDCAD MONTHLY CHART.
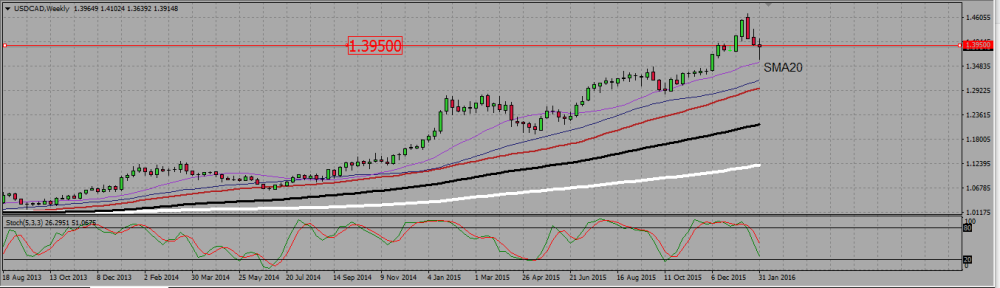
On the weekly chart, we are in a bullish trend, but entered a bearish correction three weeks ago. The last weekly candle is however a kind of hammer, bouncing from the 20 SMA support. This makes me think the bearish correction may be over.
USDCAD WEEKLY CHART.
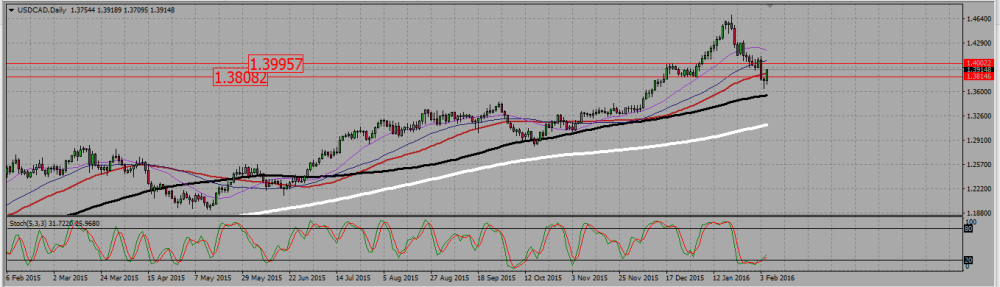
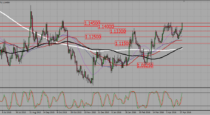
The daily chart shows a little bit better that bearish correction. We see there was a hammer on Thursday, followed by a nice bullish candle on Friday that even re entered a support/resistance area between 1,38 and 1,40. I will look at price action around those two values. A bearish break out of 1,38 would probably induce some more of that bearish correction, while a bullish break out of 1,40 would probably mean the bullish trend is back on track.
USDCAD DAILY CHART.
 (No Ratings Yet)
Add your review