
1-EURUSD trading plan.
Sell pull backs to 1,0025 or sell a bearish break out of 1,07 towards 1,061.
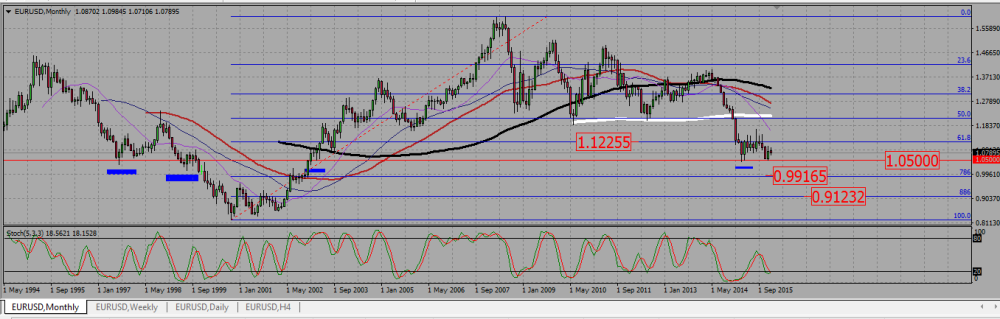
The EURUSD is still without any clear trend on the monthly chart. After rejecting a support around 1,05, it ended this week with a tiny, spinning top bearish indecision candle.
EURUSD MONTHLY CHART.
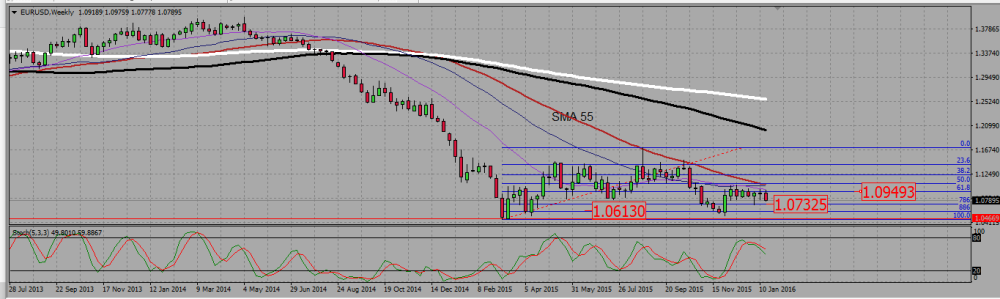
On the weekly chart, we see a rather bearish trend (with most SMAs pointing down). The pair is mildly drifting down within the Fibonacci retracement of a bullish consolidation that took place between March and August last year. This week candle is a clear bearish one, falling from the 61,8 retracement around 1,095, and ending near last week low, meaning bears are gaining in strength. The next Fibonacci supports are the 0,786 at 1,07325 and then the 0,886 at 0,10610.
EURUSD WEEKLY CHART.
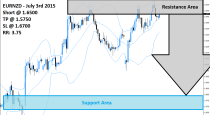
The daily chart tells us that bearish strength appeared on Friday. The pair even managed to close under a minor support at 1,0825, which stands now resistance, and under it I will rather look to sell the euro. We are still above a support area 1,0775 -1,07, therefore I do not want to enter a short without a pull back to the 1,0825, or a clear breakout of that support zone first. I will set my TP at the 1,061 support we noticed on the monthly chart. I do not plan to buy the eurodollar unless it breaks up the weekly 55 SMA that acted already twice as a resistance.
EURUSD DAILY CHART.

2-GBPUSD trading plan.
Watch H4 20 SMA support around 1,42. It it holds, or if we break up 1,43, we may see a serious bullish move. If it is broken down, the bearish trend will probably resume.
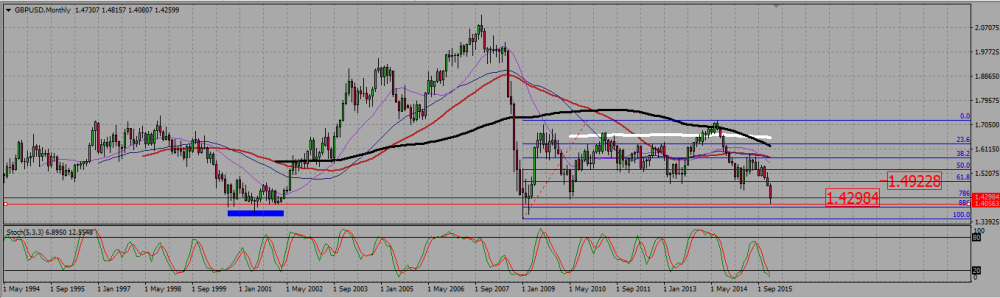
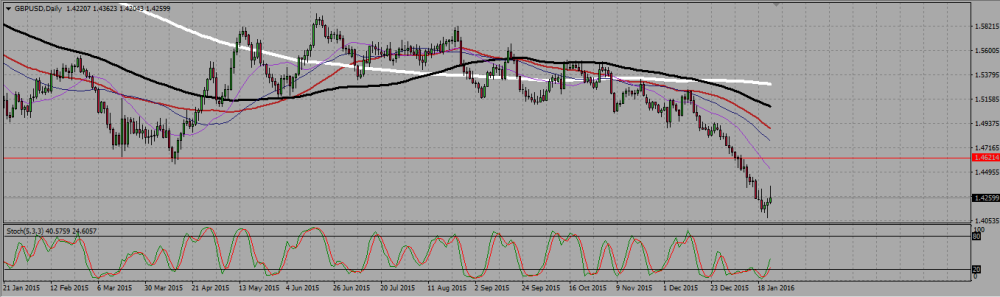
On the monthly chart, we see the pound fighting with a strong support around 1,43. It is a 0,786 Fibonacci level support, a former monthly low from 2010, and a whole support area from 2001. Also, there is no strong trend and we see a weak stochastic bullish divergence. That thing may just go up. Please note how the down wick of this month candle is at the same level as the support area from 2001.
GBPUSD MONTHLY CHART.
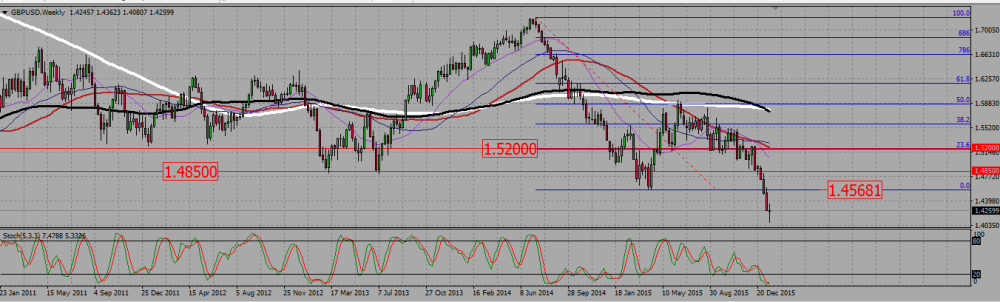
On the weekly chart we see a more bearish configuration, with SMAs rather pointing down, and three strong bearish candles that broke a support at 1,45. However the last candle is a long legged doji, meaning an indecision. We saw on the monthly chart that the low of that candle is on a strong support. However, an indecision candle just means indecision. It does not mean a reversal yet.
GBPUSD WEEKLY CHART.
On the daily we see that although the pound gave a hammer on Thursday, there was no follow through, and Friday candle shows a strong up wick: the bulls are fighting to get control of that pair, but did not managed to do it yet. As we are in a rather bearish trend, with SMAs pointing down, we need to go to the H4 chart to translate that indecision into a trading plan.
GBPUSD DAILY CHART.
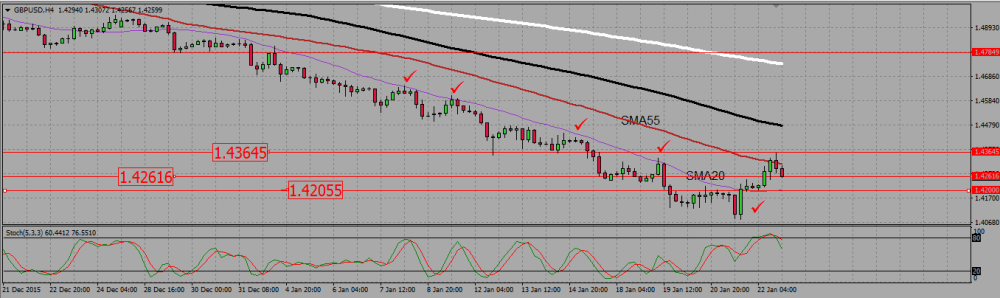
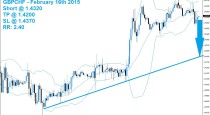
On H4 we see a clear bearish trend, but we also have a reversal figure with the breaking up of a resistance around 1,425, -which is now retested as a support. More important, please note the role of the H4 SMA20 that was resistance again and again, but that has been broken and now acts as a support. That SMA is now flat and located around 1,42. As long as we are above that level, there is a strong chance we will be going up. On the other side, a bearish break out of that 1,42 level means we are probably back into the bullish trend.
GBUSD H4 CHART.
3-USDJPY trading plan.
Above 118 assume the bullish trend is resuming. Under it, try to sell the yen to go back to 116.
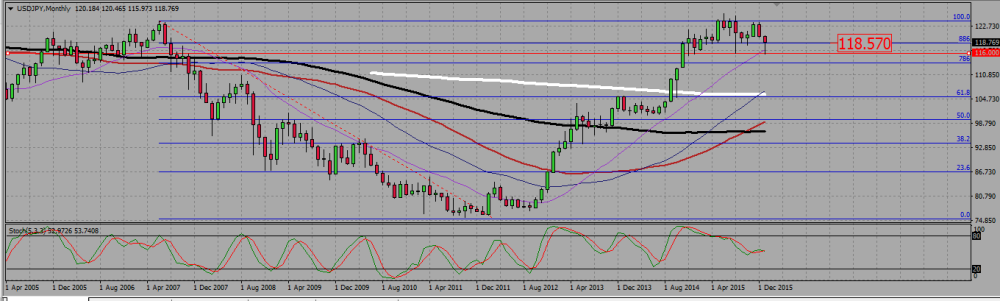
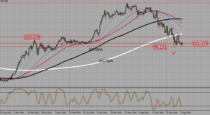
JPY monthly chart show an uptrend. The pair stopped climbing in July 2015 with a hanging man, and the two last candles (December 20158/January 2016) are bearish. But the yen did not manage to break down 116, which is a quadruple bottom ; the wicks we see at that level means it is strongly defended -Bank of Japan ?-. The pair managed to climb back over a 0,886 Fibonacci level that stands at 118,5 and that is now support.
USDJPY MONTHLY CHART.
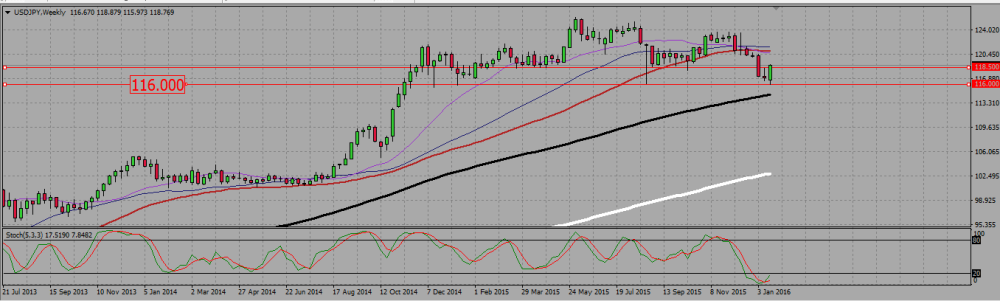
On the weekly chart, we see a bullish harami reversal pattern at 116. This chart also shows we are against a resistance zone. As the long term trend is bullish, and the last candle a strong engulfing bullish one, chances are we are going up.
USDJPY WEEKLY CHART.
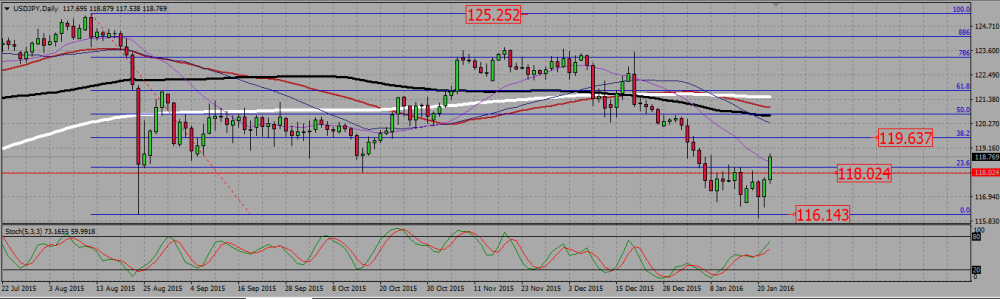
The daily shows us in detail the bullish reversal pattern. The line we saw on bigger time frames around 118,5 may be here located ad 118,0, and this is the support I do not want to see broken. Under it, I think the yen will rather go back to test that 116 level again. Above it, we should go up to test the 119,6 Fibonacci resistance and may be higher. SMAs are mixed to going down, indicating there is no clear trend on the daily chart fort that pair.
USDJPY DAILY CHART.
 (1 votes, average: 5.00 out of 5)
Add your review