
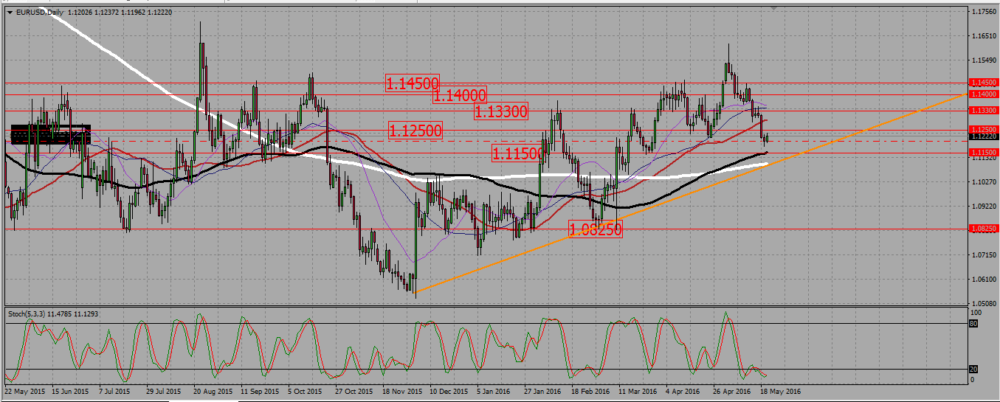
Pay attention to price action around 1,1175-1,115, and buy reversals there towards 1,114, or sell confirmed break down towards 1,0825 and below.
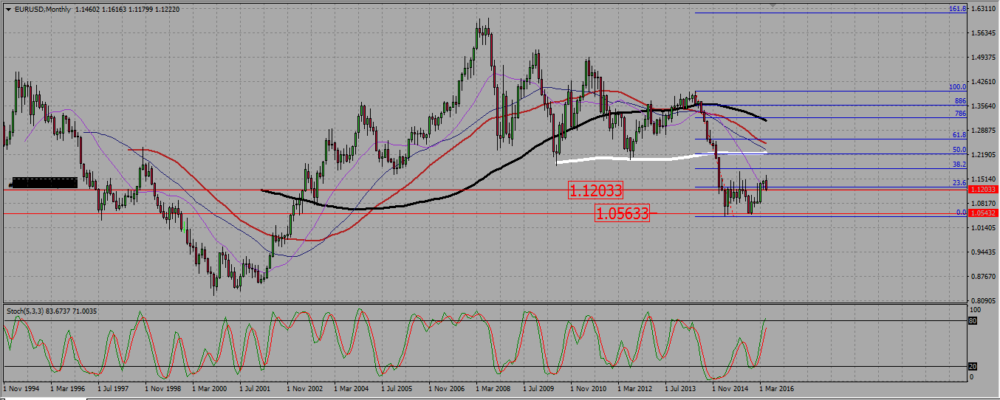
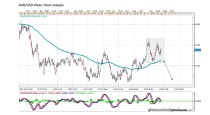
On the EURUSD monthly chart, and after breaking a resistance near 1,12 in March, the pair showed a very small candle in April, and is this month strongly pulling back. It is retesting as a support the broken resistance around 1,12.
EURUSD MONTHLY CHART.
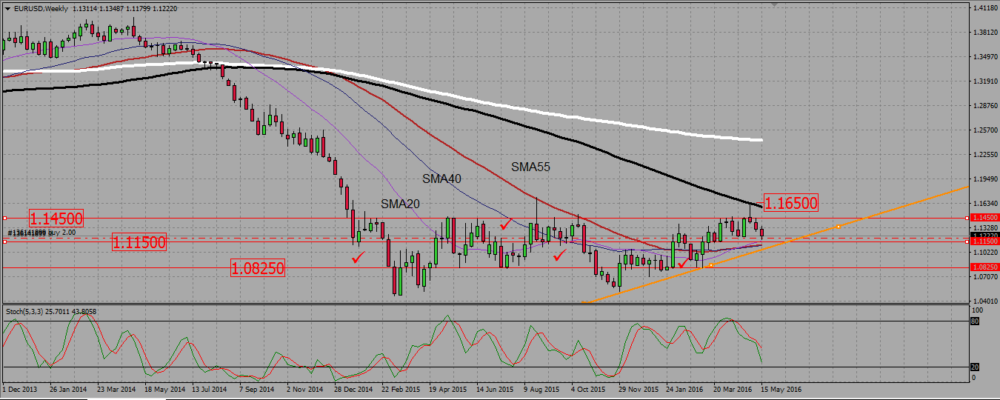
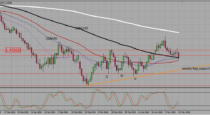
The weekly chart allows us to better see the whole picture. The broken monthly resistance is actually closer to 1,15 -see checked items on the chart-. The euro is now approaching that level with two small bearish candles. Three short terms SMAs -20,40 and 55- are also locating under 1,15, starting to point up as for an up trend.
EURUSD WEEKLY CHART.
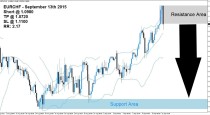
If we look at the daily chart, the pair is in an uptrend, as SMAs are pointing up. Thursday’s candle is a hammer, with moderate follow trough on Friday. We see both 100 and 200 SMAs indicators coming a supports under 1,115, with a support trendline very close.
As we see a hammer, it may be the up move has already started. In such a case, we will have to buy EURUSD pull backs above 1,115 to try to get into any longs. But as there is little follow through, it may be the pair will go once more into the 1,1175 1,115 zone before -eventually- reversing.
EURUSD DAILY CHART.
 (1 votes, average: 5.00 out of 5)
Add your review