
Although still in a range, the pair seems to turn slowly bullish. I will rather buy signal above 1,1 towards 1,13. the 1,13 1,1325 level must be monitored for a bullish break out towards 1,145 or a bearish rejection to go to 1,105. I will sell a break down of 1,10 towards 1,085.
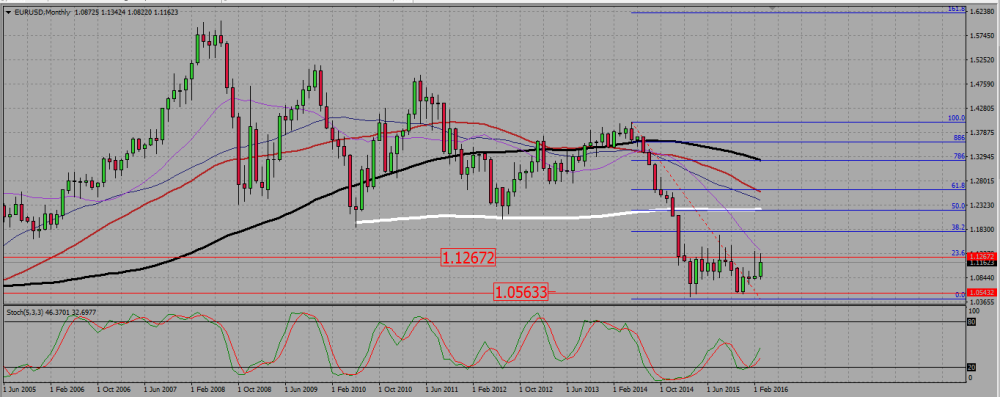
On the monthly chart, the pair is struggling with a monthly range resistance around 1,125. The numerous up wicks we see on the graph indicate that range resistance is tough to pass.
EURUSD MONTHLY CHART.
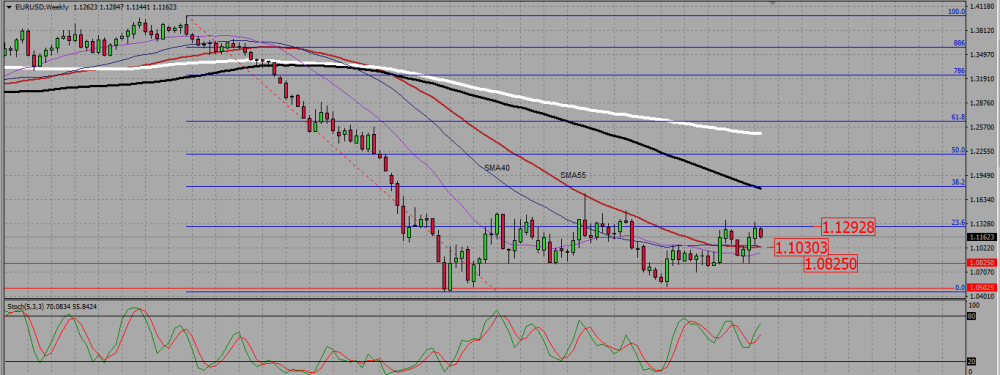
The weekly chart is a little bit more contrasted. The SMAs are pointing down, meaning the bearish pressure is here, but since November the bullish candles are stronger and bigger than the bearish ones; that pair is trying to rise. The last two candles form a dark cloud cover pattern, meaning it is not the time to think long yet, but a retest of the two SMAS -55 and 40- near 1,1025 would be a good spot to look for buying signals.
EURUSD WEEKLY CHART.
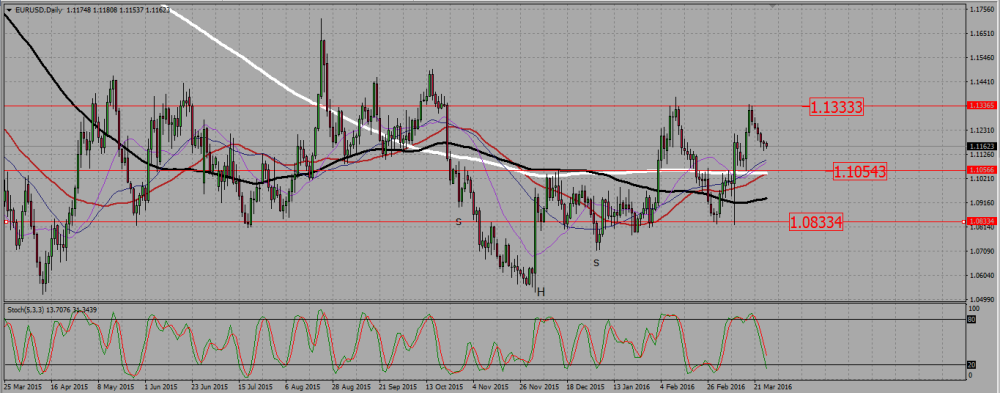
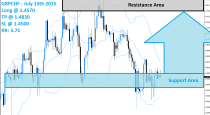
The daily chart even looks slightly bullish. The SMAs are flat or starting to point up, and we see better the strength of the bullish candles compared to the bearish ones. There is an inversed head and shoulder, with a breaking line around 1,105, where the 200 SMA is also located. As we also identified on the weekly chart a support near 1,1025, that whole area 1,1 – 1,105 is now a key support zone. Another very important support is located around 1,085, but I am not quite sure the pair will go that low. On the resistance side, there is a double top near 1,133, and it is a level we want to monitor closely.
EURUSD DAILY CHART.
 (1 votes, average: 5.00 out of 5)
Add your review