1-EURUSD trading plan.
Consider it in a range 1,12 – 1,133. Further resistances are located at 1,14 and 1,145. On the support side, aim for 1,11 and 1,10. There is no clear trend.
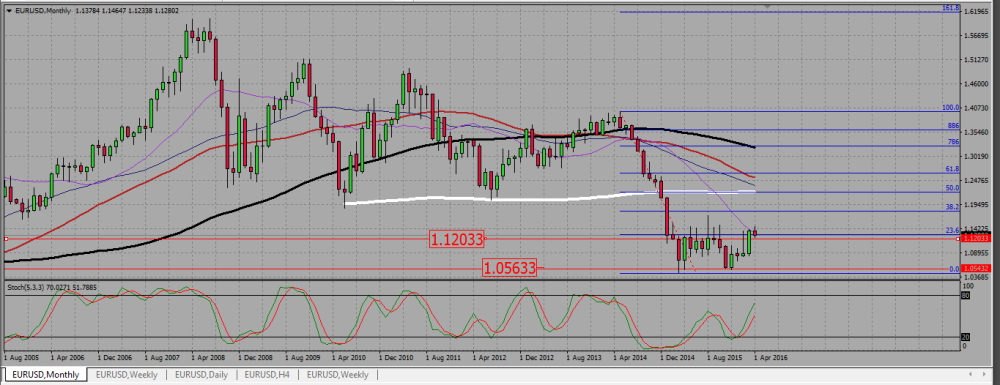
On the monthly chart, after breaking up a monthly resistance around 1,12, the pair is coming back down to retest it as a support.
EURUSD MONTHLY CHART.
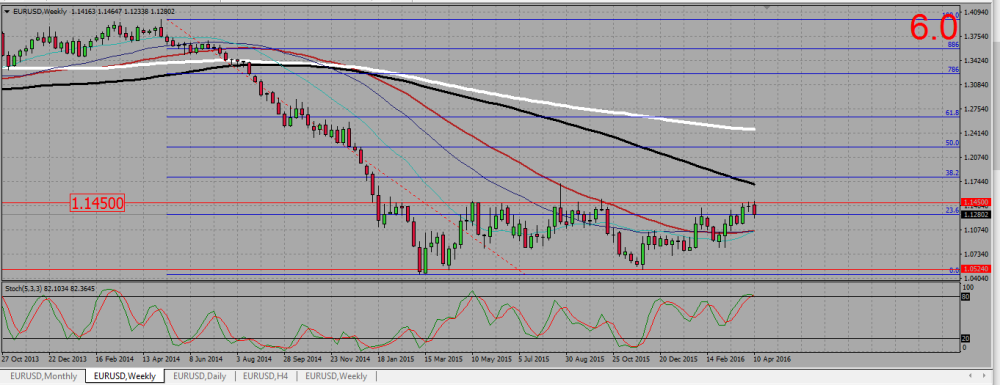
On the weekly chart, the pair completed a bearish Harami after rejecting a resistance at 1,145. The trend looks rather bearish, but this week candle ends with a down wick on a Fibonacci level: some support has been found.
EURUSD WEEKLY CHART.
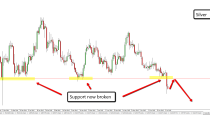
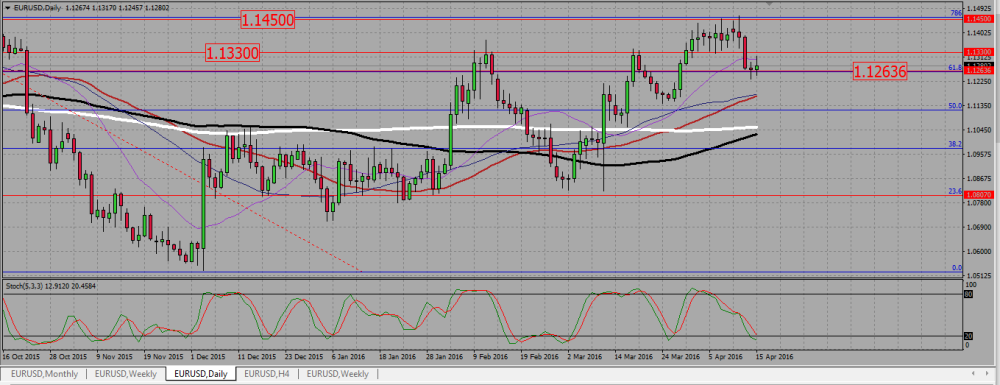
Finally, the daily chart. The SMAs suggest a rather bullish situation, but the pair broke down heavily a range support at 1,133 on Wednesday, with no follow through as the Thursday and Friday delivered high waved ranging candles. We have therefore conflicting signals here, with a broken resistance support on the monthly chart, but a powerful bearish break out of a support on the daily chart, suggesting we may go further down. This is why and as long as the euro does not clear a monthly level, meaning the 1,12 support or the 1,133 resistance, I will consider it as ranging between those two values.
EURUSD DAILY CHART.
2-USDCAD trading plan.
The loonie looks very bearish on short terms charts, but it is entering a solid support zone on the monthly and weekly chart. Watch price action around 1,29, and sell/buy signals there, but be wary on the down side, because 1,28 – 1,26 is a strong monthly and weekly support zone. Buy daily signals in that area, and sell confirmed break down of 1,26.
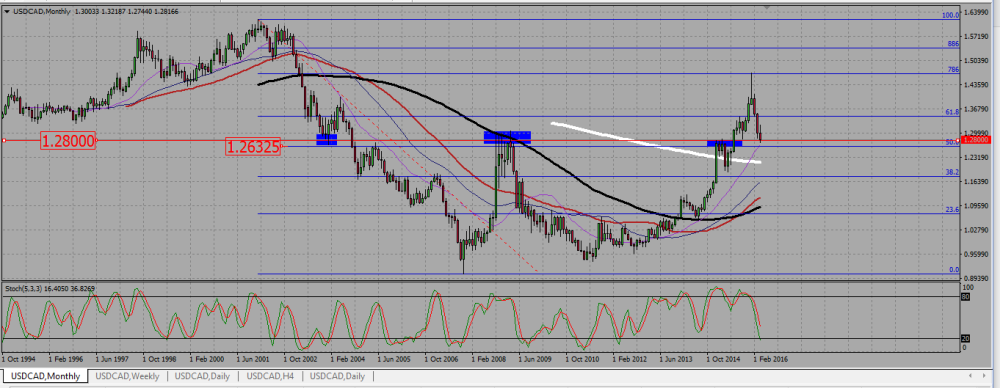
On the monthly chart, the USDCAD is consolidating down since the beginning of this year. But it is now facing its first real challenge, with a tough support zone between 1,28 and 1,26, where a 50 Fibonacci support level is located. Shorting the pair in or just above that area is not a good idea.
USDCAD MONTHLY CHART.
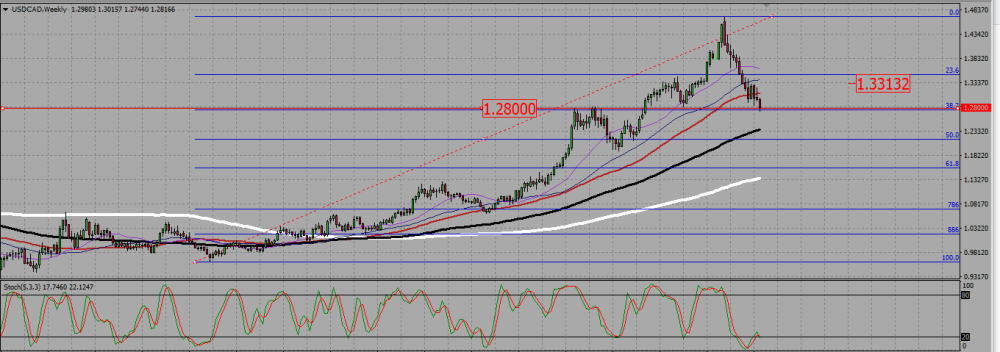
On the weekly chat, the SMAs are still pointing up, as for a bullish trend. We are still merely inside a bearish consolidation of a bullish trend. On this chart 1,28 is an obvious support. As we are going to discuss, short term charts are very bearish, therefore I will be very cautious about taking longs at that level. I would need a very strong reversal candle on H4, or even better, a signal on the daily chart.
USDCAD WEEKLY CHART.
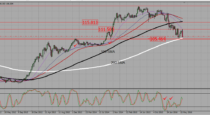
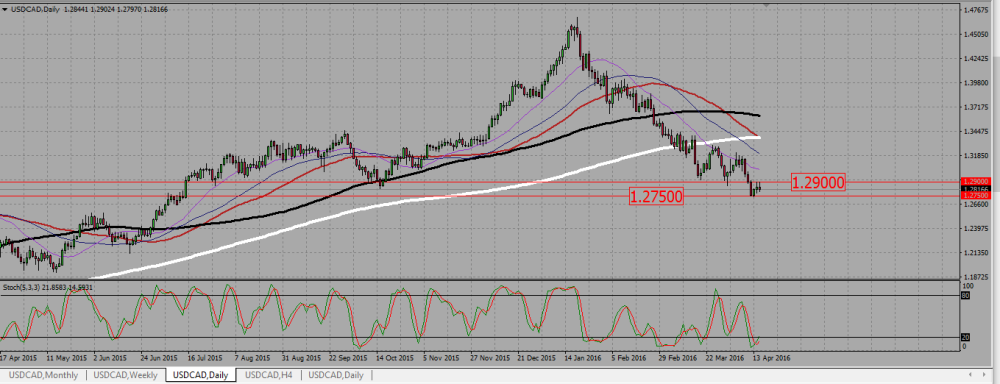
On the daily chart we better see that bullish correction. It is strong and the pair just broke down a support at 1,29. This level has even been retested, and is in the process of being rejected as a resistance. This is why I will sell any signal just under it, but not any lower; as we saw the whole zone 1,28 – 1,26 is a support. The pair did by the way find some support at 1,275, but the bullish move that followed is not strong. I would not long such a weak pull back. But a bullish break up of 1,29 would make me enter long.
USDCAD DAILY CHART.
3-AUDUSD trading plan.
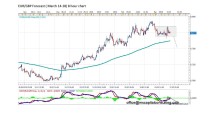
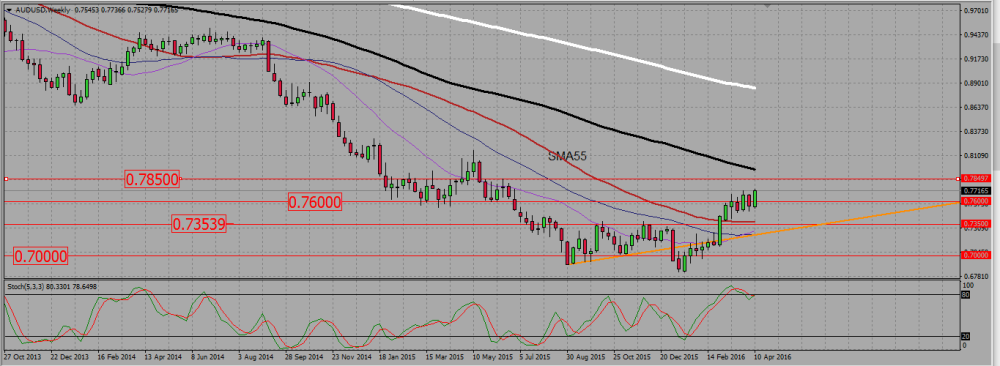
Once again it is all on the weekly chart. The pair broke up a resistance around 0,76, but the follow through is very slow. Hopefully there is a support trend line that we may use to look for long signals. My take profit level will be the 0,785 resistance level; as the follow through is weak above 0,76, I do not think the resistance at 0,785 will be broken on the first atttempt.
AUDUSD WEEKLY CHART.
 (2 votes, average: 5.00 out of 5)