
EURUSD trading plan.
Watch price action at 1,06. Buy reversals above it towards 1,0725, sell signals under it and hold, minding the 1,05 and 1,045 support levels. As we enter the month of December, and as all eyes will slowly turn to the Fed’s decision on December 16th, take only very clear signals. (see FED’s desision calendar here >>)
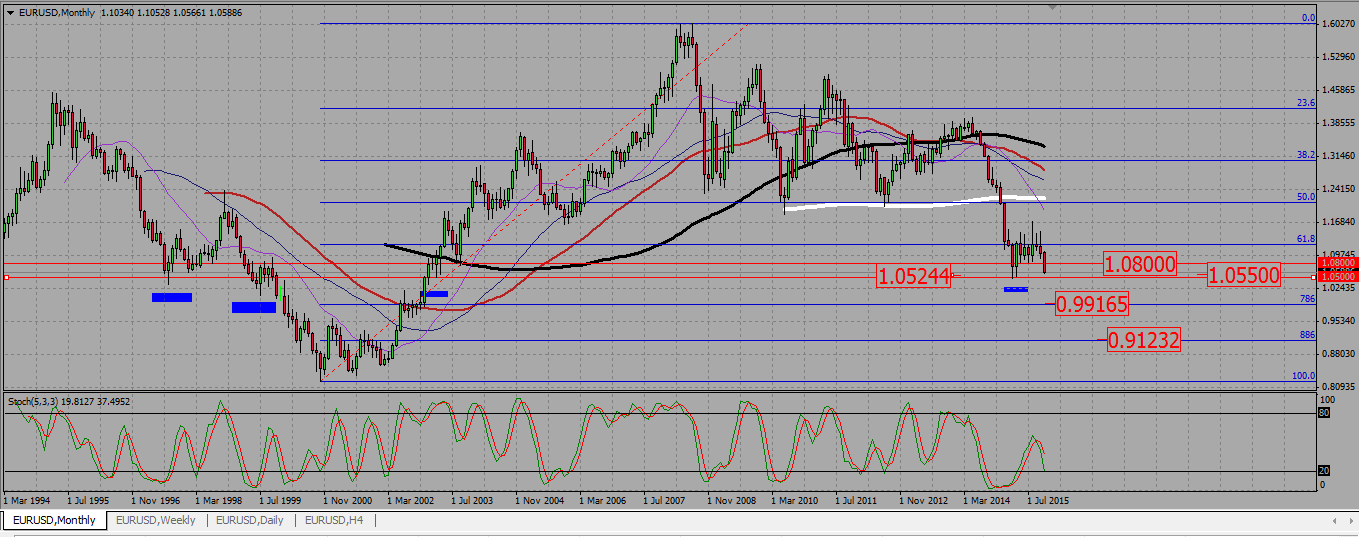
Looking at the monthly candle we see the pair ending November with a nice bearish Marubozu, breaking a support at 1,08, and getting close to a level -1,045- that resisted last time it was tested and sent the pair back up to 1,14. The pressure is obviously down, but please remember we still have a strong support to break.
EURUSD MONTHLY CHART.
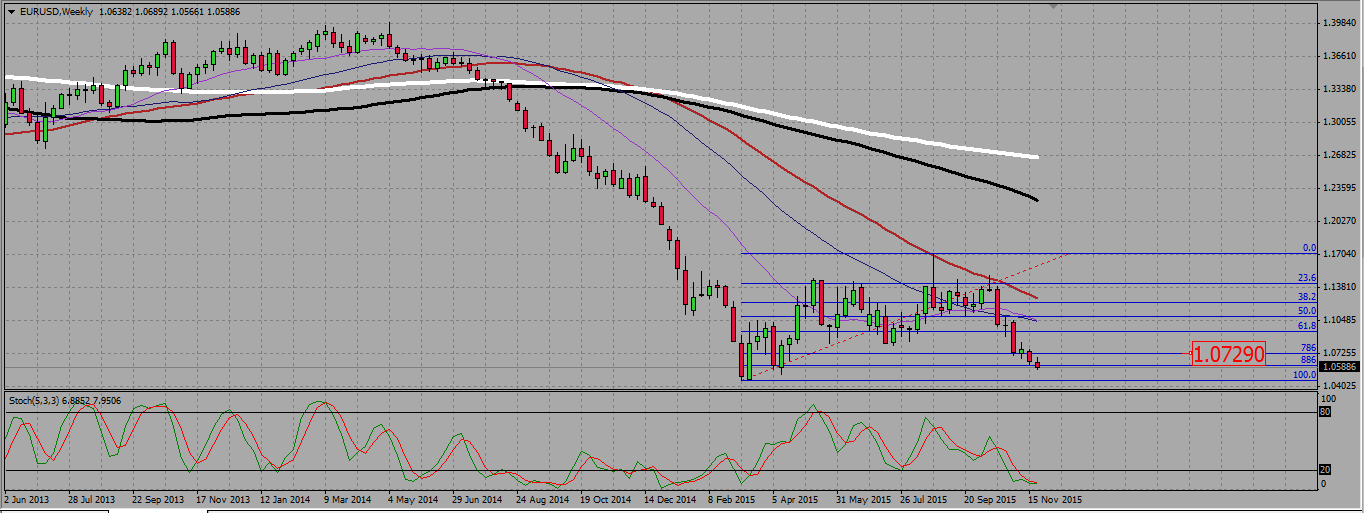
On the weekly chart the bearish move is loosing strength. The last candle is a spinning top bearish candle, loosing barely 50 pips in the week. The pair also stands on a 0,886 Fibonacci level around 1,06.
EURUSD WEEKLY CHART.
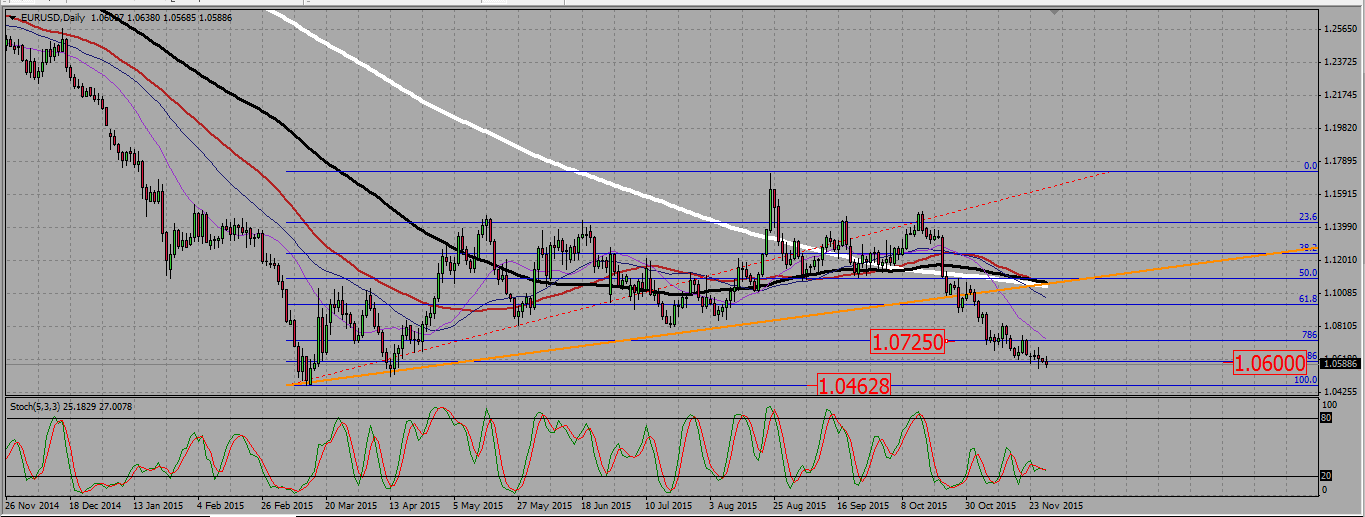
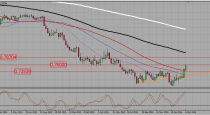
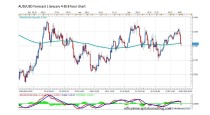
Finally on the daily chart we see the pair hesitating around that 0,886 Fibonacci level. A reversal at that level should send the pair back to retest the 0,786 level at 1,0725, while a confirmation of a bearish break out would mean a test of the monthly support around 1,05 1,045.
EURUSD DAILY CHART.
USDCAD trading plan.
Sell any signals between 1,345 and 1,332, but by and hold a confirmed break out of 1,345.
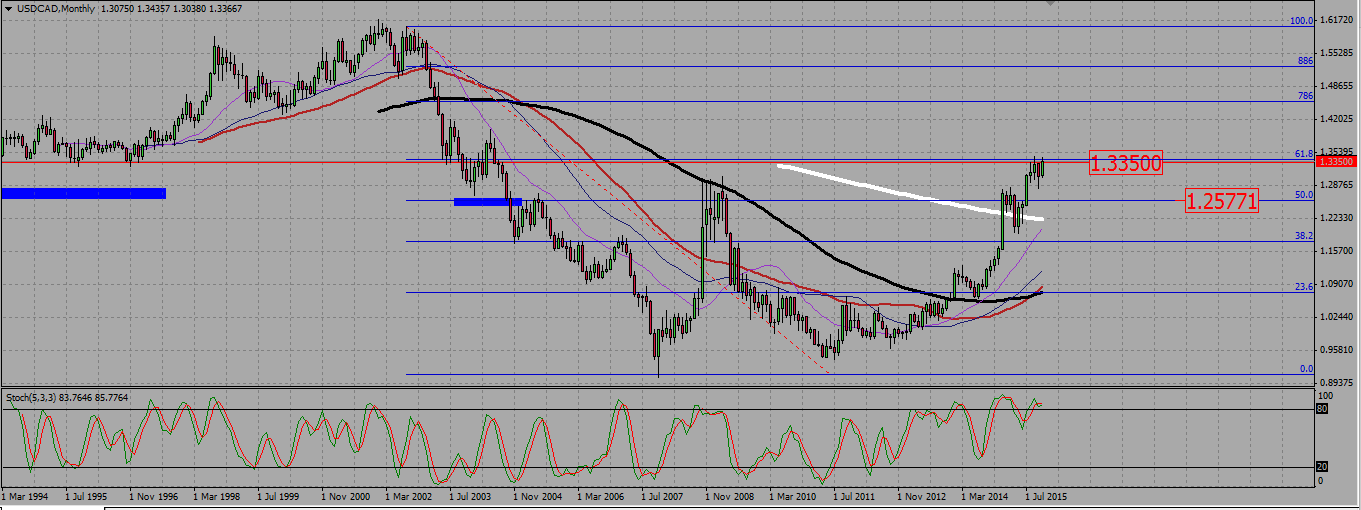
On the monthly chart, October’s candle was a hanging man. But we did not get the bearish consolidation that should have followed, and instead the loonie is ending the month by retesting last high at 1,345. This level is however a very strong resistance.
USDCAD MONTHLY CHART.
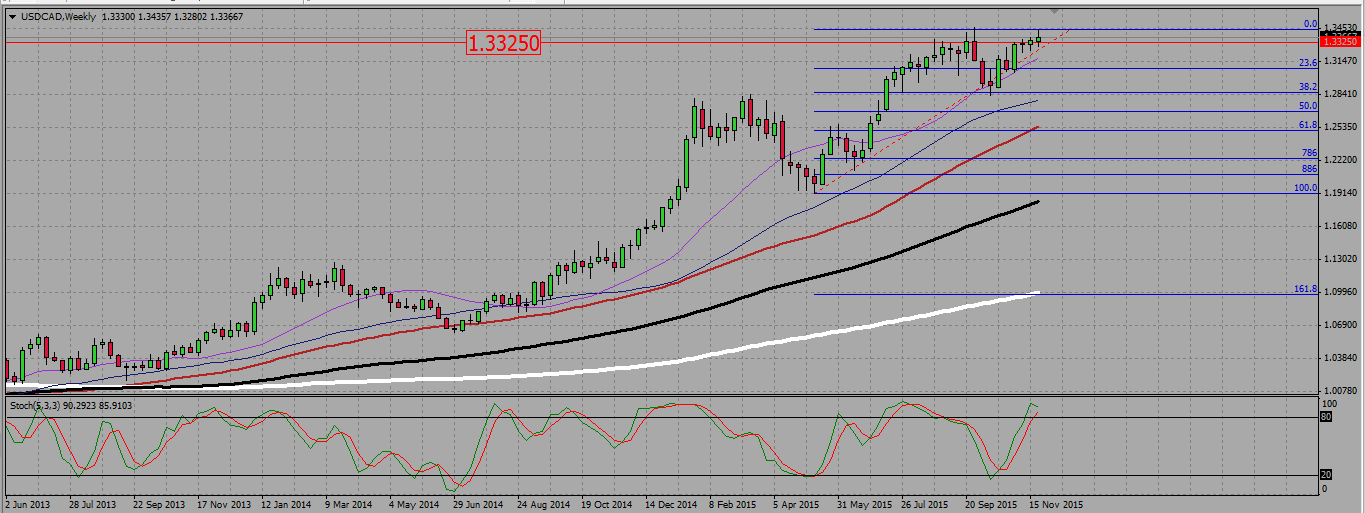
On the weekly chart the pair is still in an uptrend, but we see a small high waved bullish candle, that barely managed to stand above a resistance/support level around 1,3325. The move may rise out of steam, and as we are facing a very tough resistance, I will not rule out a bearish reversal on that pair.
USDCAD WEEKLY CHART.
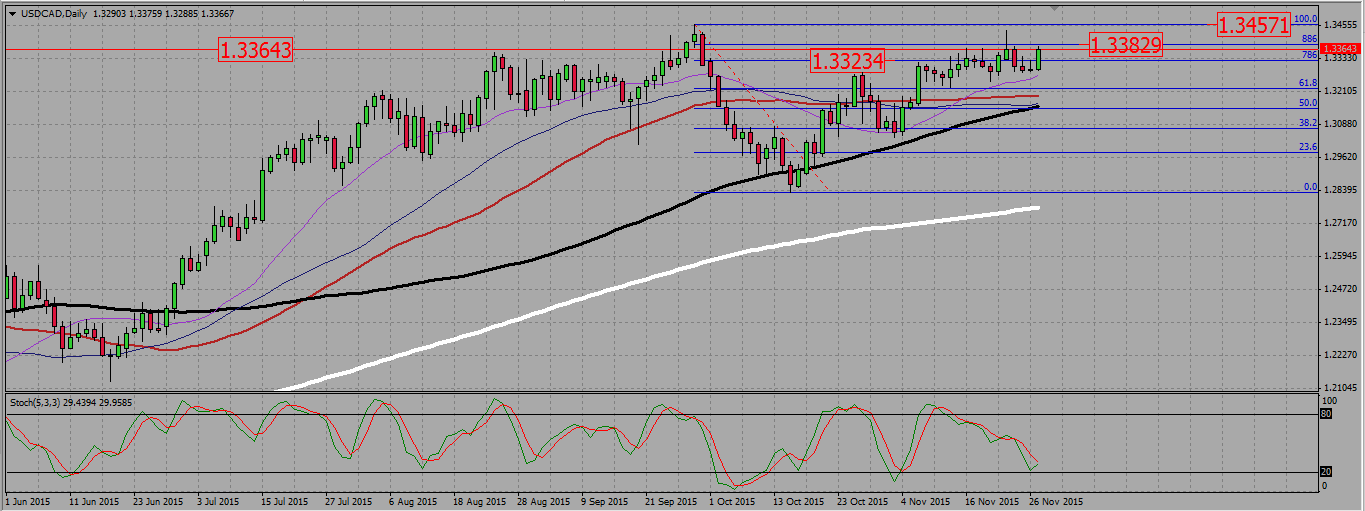
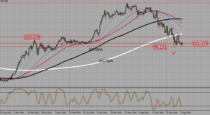
On the daily chart, we started the week with a bullish shooting star on Monday 20th, but there was little follow through. Then on Friday we see a solid bullish candle that closes at the same level as Monday’s candle, around 1,336. That level is obviously a resistance, but the pressure is up.
Technically, every selling signal on a resistance (1,336, 1,338 and then the last high at 1,345) is a valid signal. But with oil price so low, a bullish break out of 1,345 may also come into play. In that case I will wait for a pull back before buying the pair long term.
USDCAD DAILY CHART.
 (2 votes, average: 5.00 out of 5)
Add your review