
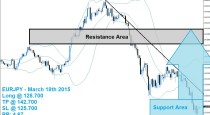
Watch price action around 1,145. Buy confirmed – with pull back and another buying signal– break up of 1,145. Do not sell reversals, but rahter buy any pull back above 1,115. Sell under 1,15 towards 1,0825.
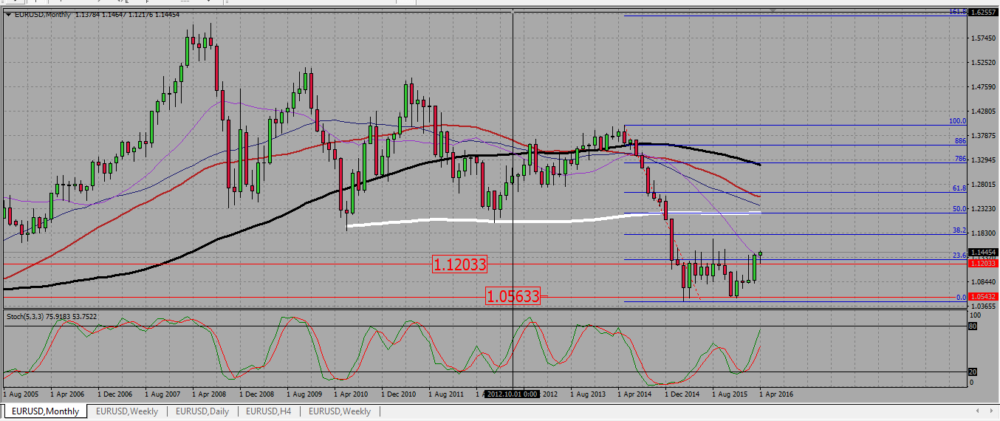
On the monthly chart, the pair has broken a resistance around 1,12, retested it, and is now moving slightly higher. Let us however keep in mind that since it started to range in March 2015, the euro has broken that resistance area already five times, only to reverse a little bit higher and to fall by more than 400 pips. On the other hand, this is the first time that a monthly candle (and even two in this case) closes above 1,12. I will wait for a confirmed break out before buying that pair.
EURUSD MONTHLY CHART
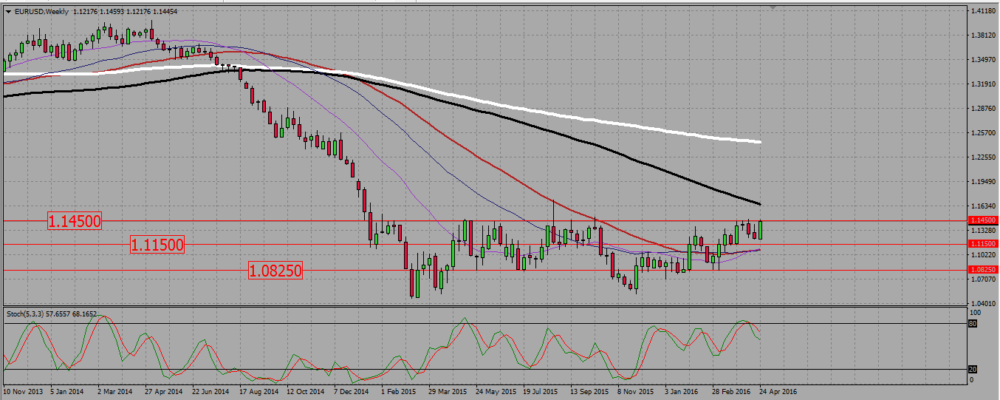
The weekly chart shows a ranging situation after a bearish trend. The pair is up against the range resistance at 1,145. We need to wait and see what will happen: a bullish break-out, or a reversal toward the range support to 1,115.
EURUSD WEEKLY CHART
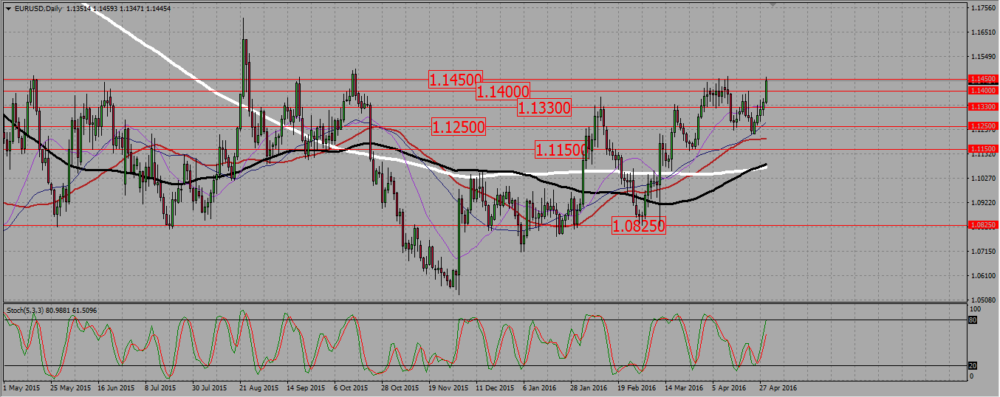
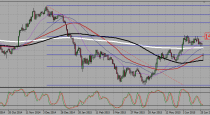
The first thing that comes in mind when we looks at the daily is : this pair is turning into an uptrend. The SMAs are all starting to point up and getting parallel. We even see the 100 SMA crossing the 200. As this looks like an uptrend, I would rather buy signals as long as the pair remains above the monthly support around 1,115. But a breakdown of that support would make me look for selling signals to go to the next support around 1,0825.
EURUSD DAILY CHART
 (1 votes, average: 5.00 out of 5)
Add your review