
Good opportunities for entry next week. Forex Weekly Technical Analysis based on the Support, Resistance levels, Trend lines, EMA. (Forex weekly forecast by Camilo R.)
Helpfull links: Real Time Forex Charts (Live), Forex Economic Calendar news (Live)
AUDCAD, EURJPY, EURUSD, NZDUSD
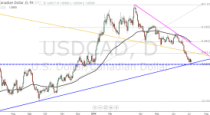
AUD/CAD Weekly Forecast
Monthly Chart:
Click pictures to enlarge
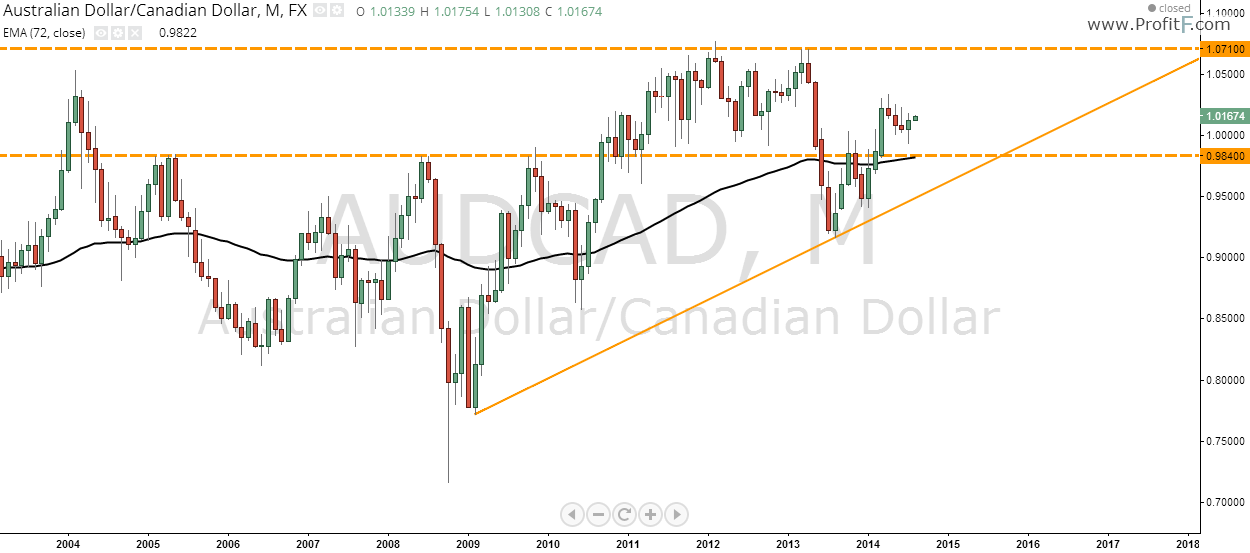
At monthly chart we can see the pair arrested in a area between 1.0710 and 0.9840. There is a uptrend line some pips bellow.
Weekly Chart:
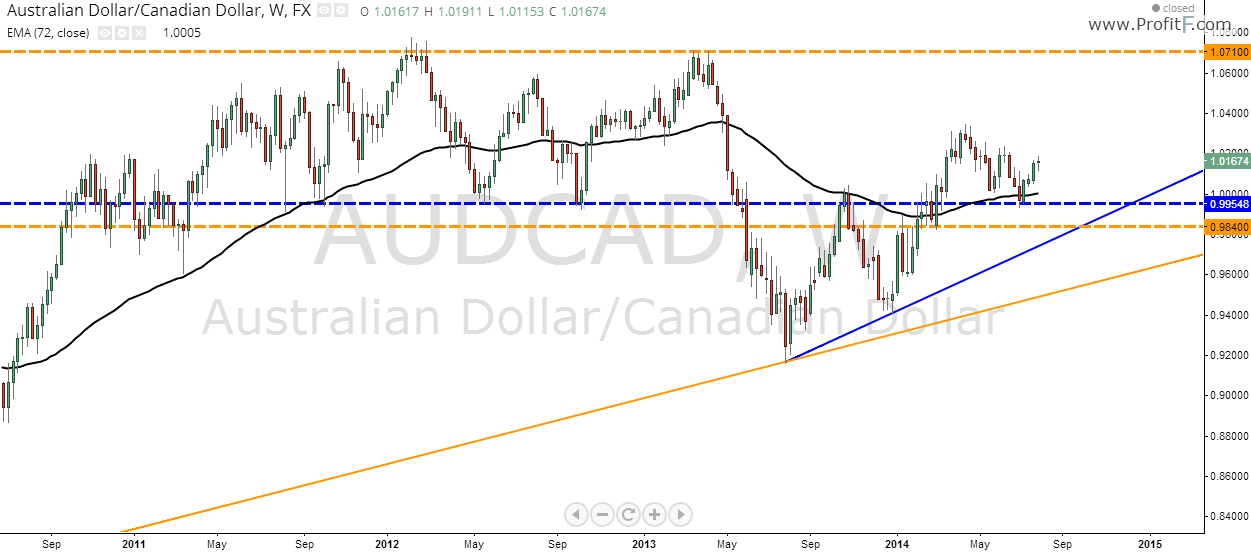
The weekly chart the price recently retested a support area around 0.9955 in confluence with the EMA72. There is a uptrend line bellow the price too.
Daily Chart:
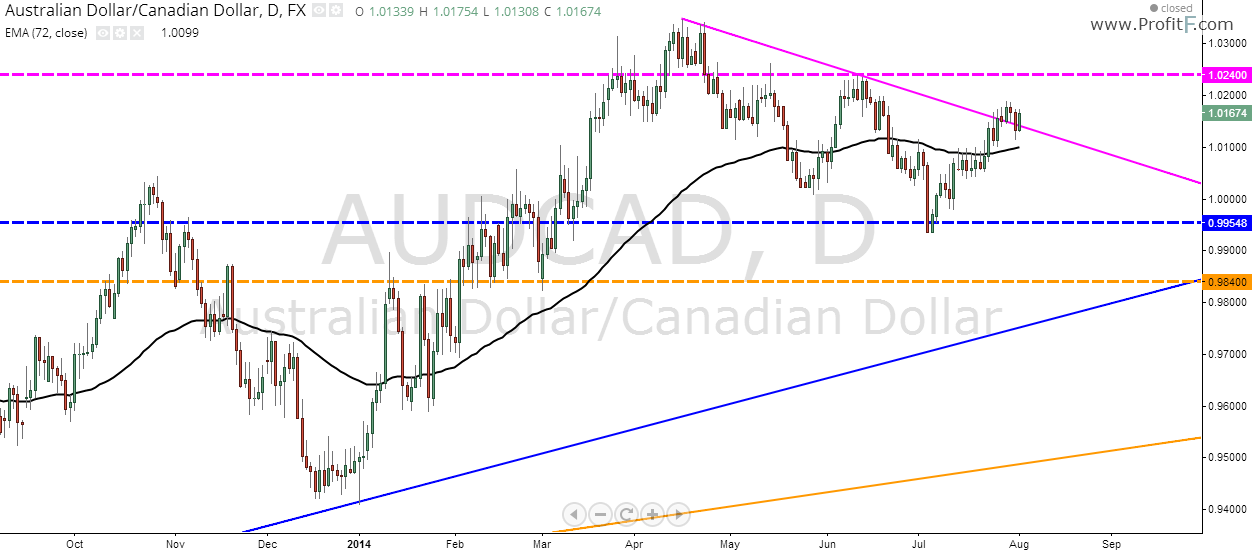
At daily chart we see that after the pair retested the weekly support area he was able to break the downtrend line, unfortunately there is a resistance area at 1.0240; after break this resistance line the pair probably will look for the monthly resistance at 1.0710.
EUR/JPY Weekly Forecast
Monthly Chart:
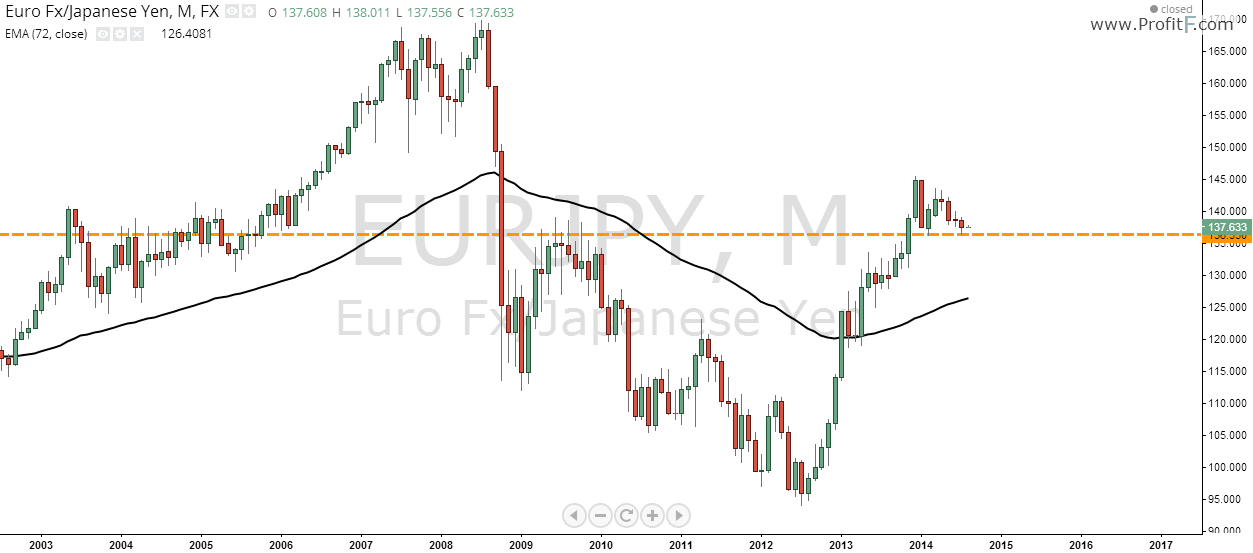
At weekly MT4 chart we can see a support area around 136.35.
Weekly Chart:
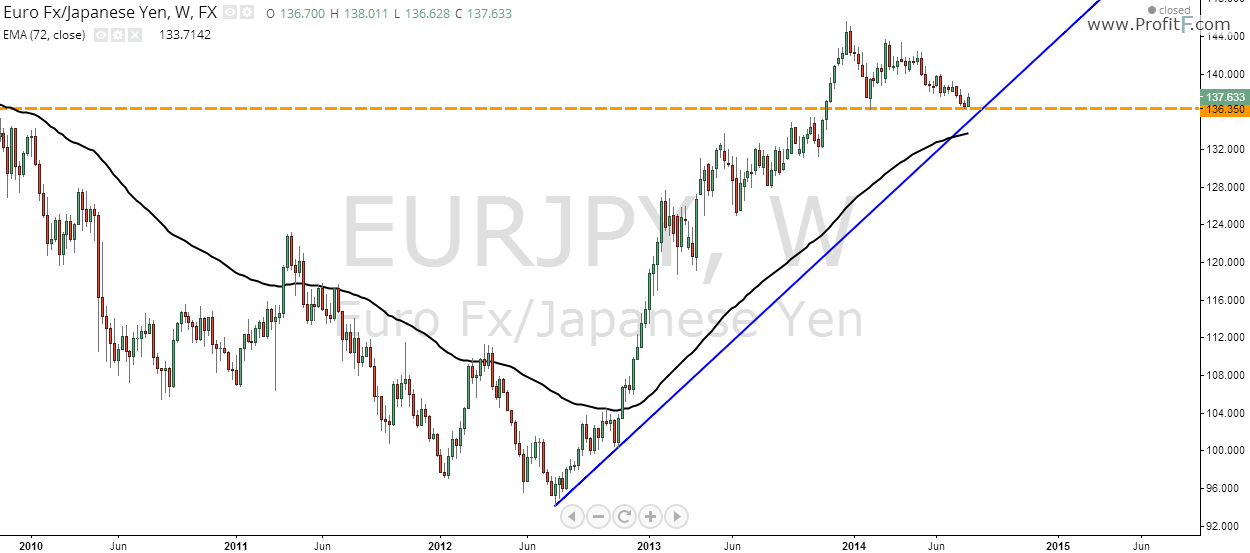
The weekly chart show us only a uptrend line near the price.
Daily Chart:
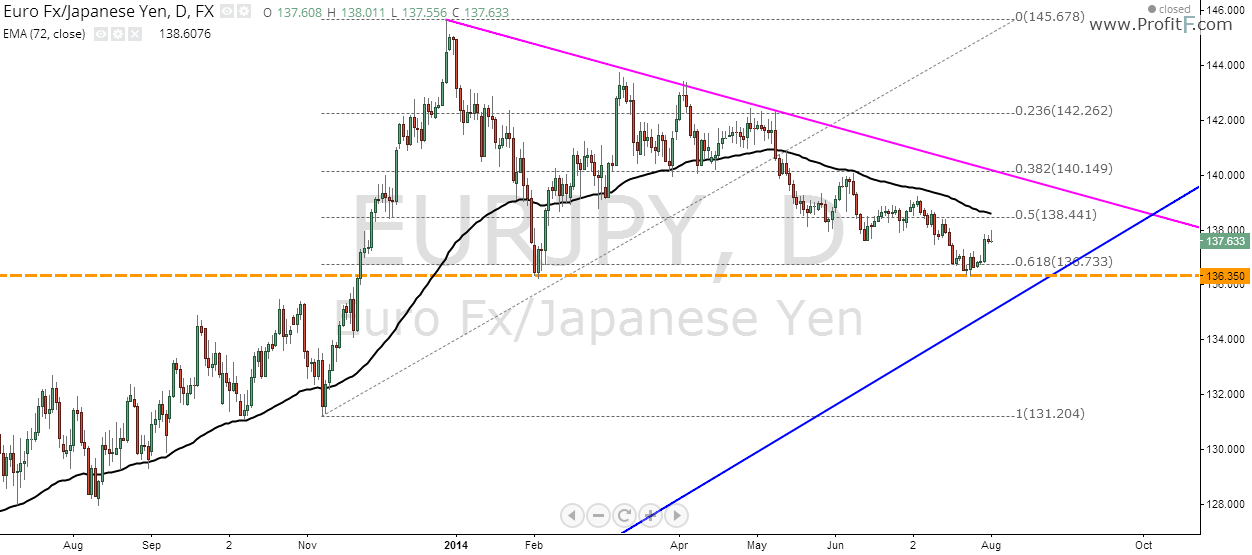
At daily chart we can see the price tested the 61.8% of the last Fibonacci Retraction but was no strength to break the last top. Now the pair is in a triangle, there is two views of the pair now. He can touch the weekly uptrend line and get strength to break the daily downtrend line. Or he will break the monthly support and the weekly downtrend line and start a new down trend.
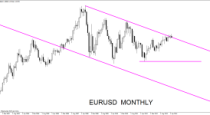
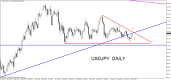
EUR/USD Weekly Forecast
Monthly Chart:
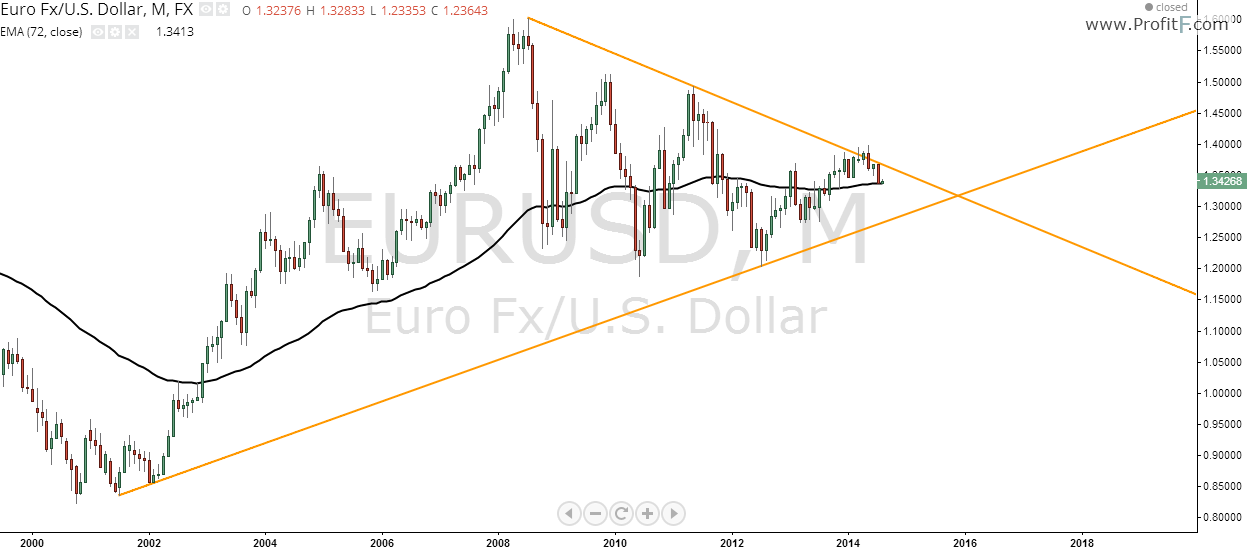
The monthly chart show us two trend lines, and the price is now touching the EMA 72 as support.
Weekly Chart:

At weekly chart the price already broke the support are with the uptrend line and EMA72.
Daily Chart:
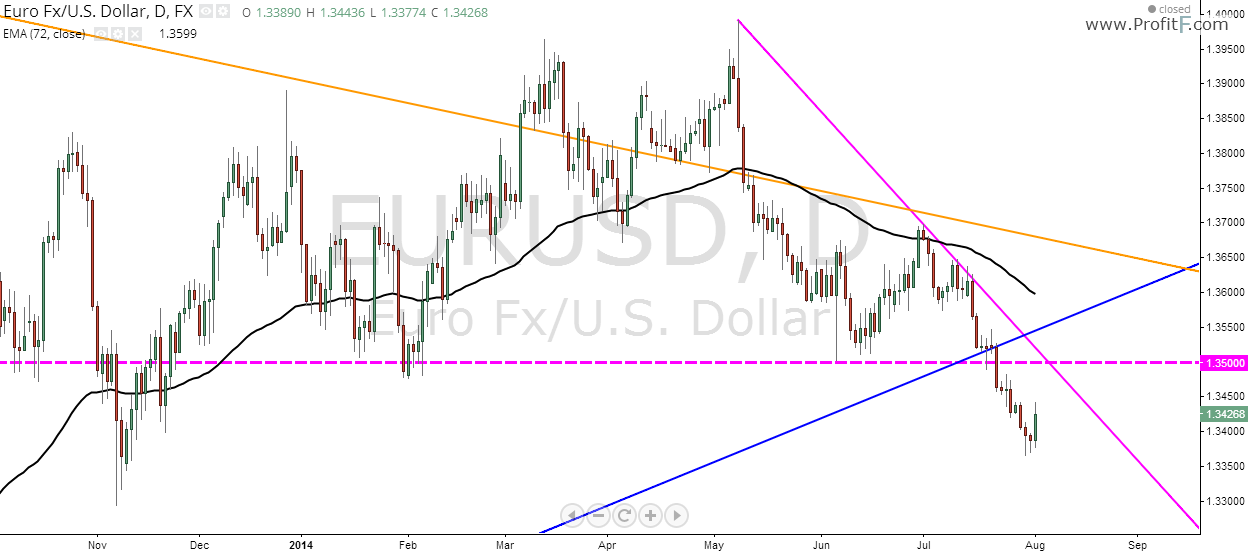
At daily chart last week the price broke the strong support area with confluence of many factors. Now he will probably look for the last valid low or the monthly uptrend line.
NZD/USD Weekly Forecast
Monthly Chart:

The monthly chart show the price in a triangle, the historical top 0.8841 held the price last week.
Weekly Chart:

At weekly chart we see the price at a support area, the uptrend line is just some pips bellow.
Daily Chart:
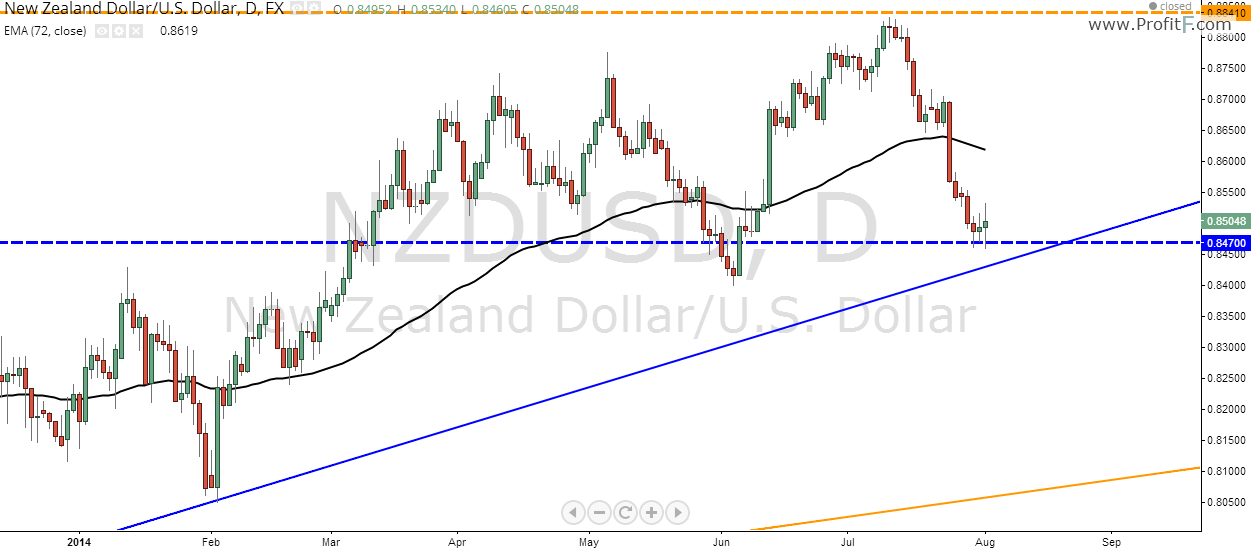
Nothing really important at the daily chart. After test the historical top at 0.8841 the pair start fall again. If he be able to break the support area and the weekly uptrend line he probably don’t will find support until the last low or the monthly uptrend line.
 (No Ratings Yet)
Add your review