
Good opportunities for entry next week. Forex Weekly Technical Analysis based on the Support, Resistance levels, Trend lines, EMA. (Forex weekly forecast by Camilo R.)
Helpfull links: Real Time Forex Charts (Live), Forex Economic Calendar news (Live)
AUD/CAD Weekly Forecast
Montly Chart:
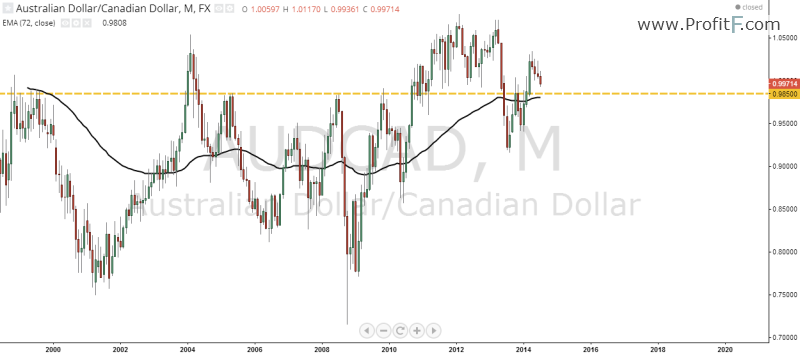
At monthly chart we can see a support line at 0.9850.
Weekly Chart:
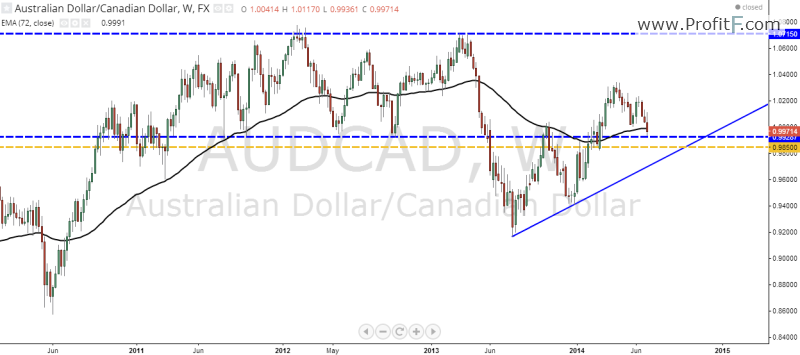
At weekly we can see the support at 0.9930, a resistance at 1.0715, the uptrend line and the EMA 72 with support.
Daily Chart:
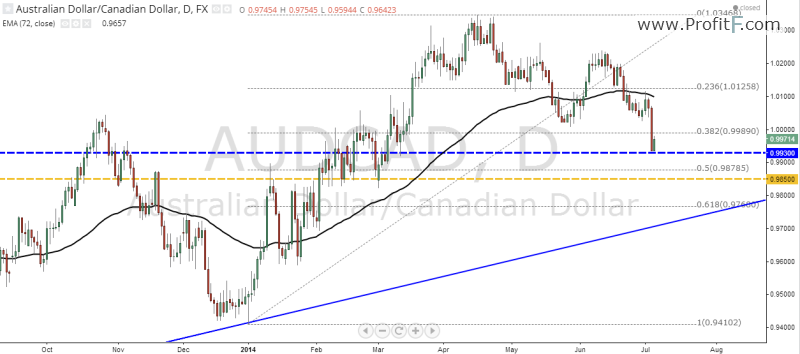
At daily chart we can see the price found support at the weekly line at 0.9930 who coincides with weekly EMA72, this area is between the 38.2 and 50% may be that is a good area to buy the pair.
GBP/JPY Weekly Forecast
Monthly Chart:
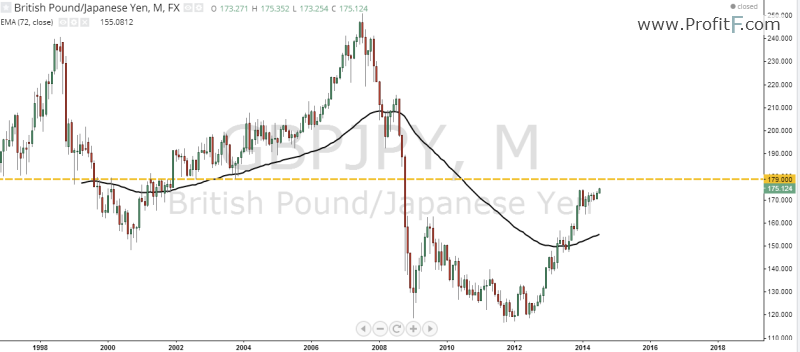
At monthly chart we just need to care about the resistance line at 1.7900 who is around 400 pips above the actual price.
Weekly:
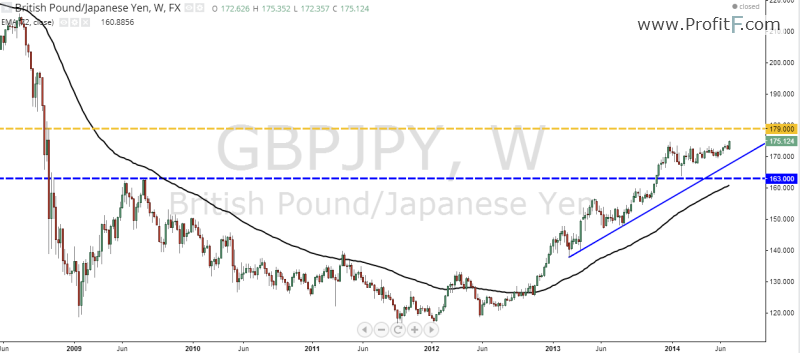
More two thing to care about at weekly chart. The support line at 1.6300 and the uptrend line.
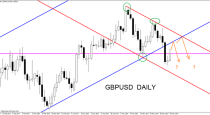
Daily Chart:
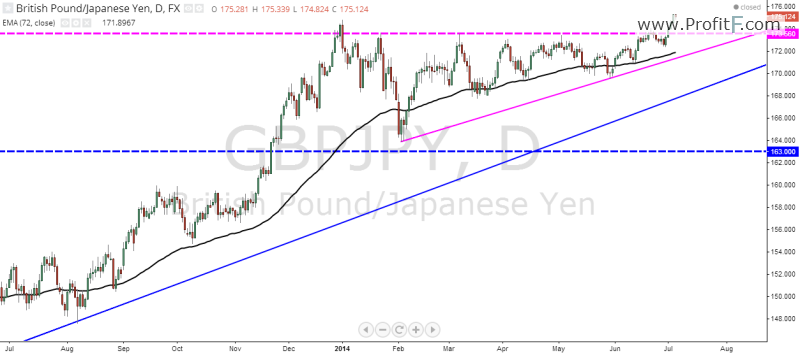
At daily chart we can see clearly a up triangle pattern broken last week, a retraction this week may give good opportunities.
H4 Chart:
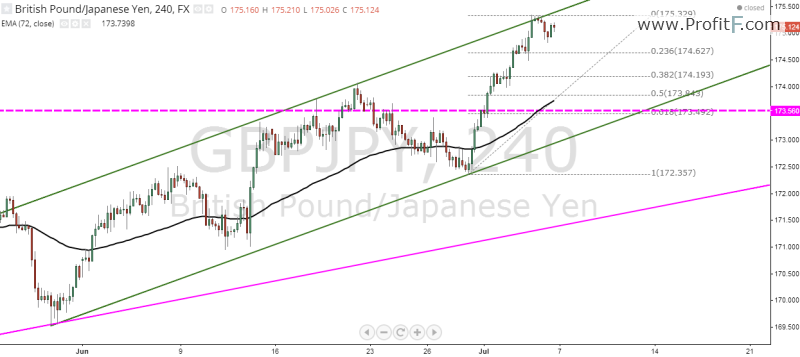
In this intraday we can see the price is in a up channel. He already touched the up band and now a retraction at the 61.8% of Fibonacci who coincide with the daily support give us a good buy opportunity.
USD/CAD Weekly Forecast
Monthly Chart:
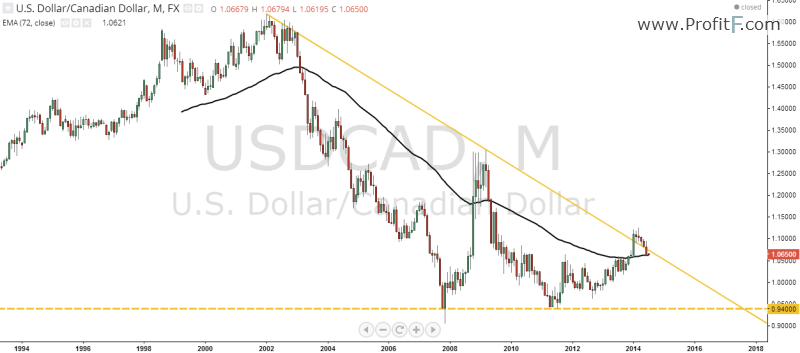
At monthly chart we see one down trend line where the price tried to broke but is get down again, the EMA 72 as support and a support line at 0.9400 very far away from the actual price.
Weekly Chart:
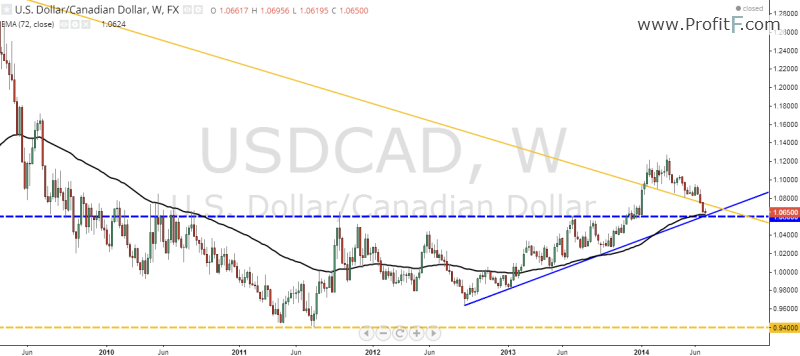
At weekly chart we can see a up trend line, a support line and the EMA 72 crossing some pips below the actual price.
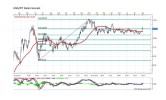
Daily Chart:
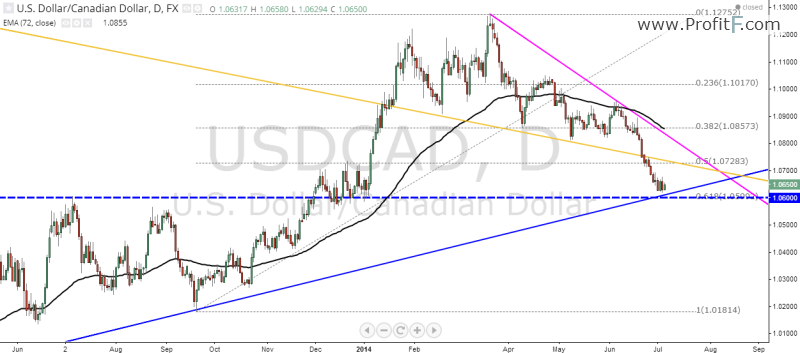
Just one thing to care about at daily chart, the pink down trend line. The price is approaching a very strong support area with five factors to hold the price: the blue weekly support line, the blue weekly trend line, the 61.8% of Fibonacci retraction, the monthly EMA 72 and the weekly EMA 72. May be that is the area the price is looking to go up again.
————————————————
 (No Ratings Yet)
Add your review