Good opportunities for entry next week. Forex Weekly Technical Analysis based on the Support, Resistance levels, Trend lines, EMA. (Forex weekly forecast by Camilo R.)
Helpfull links: Real Time Forex Charts (Live), Forex Economic Calendar news (Live)
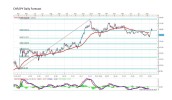
CAD/JPY Weekly Forecast
Monthly Chart:

At monthly chart we can see a resistance area around 99.00 where the price is approaching.
Weekly Chart:

At weekly chart we can see a support area between 90.70 and 92.30 and the downtrend line some pips above the price.
Daily Chart:
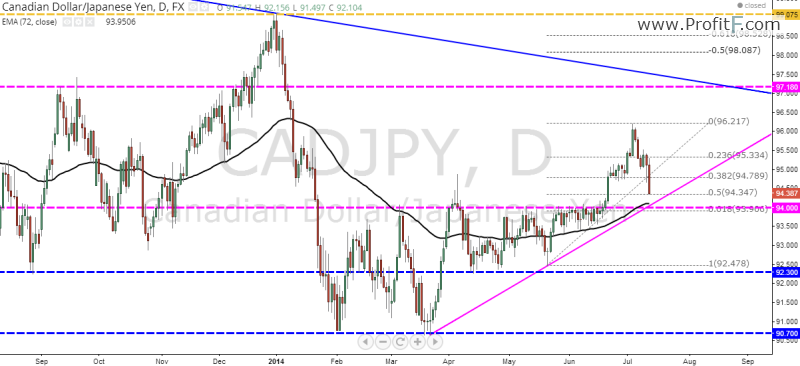
At daily chart we can see a uptrend line a support line 94.00 the EMA72 and the 61.8% of the Fibonacci retraction crossing some pips bellow the actual price. That is a strong level of support, price action confirmation at this area may give good buy opportunities.
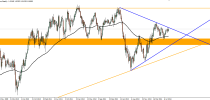
EUR/GBP Weekly Forecast
Monthly Chart:

At monthly chart we can see a down triangle formed with a downtrend line and a support line at 0.7750.
Weekly Chart:
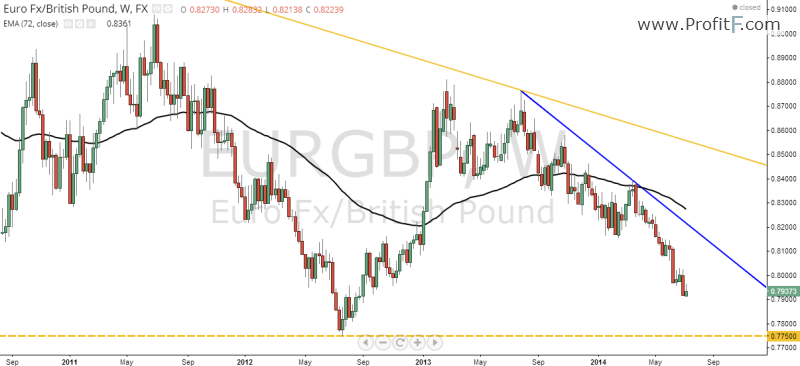
Just one thing to care at weekly chart, a down trend line.
Daily Chart:
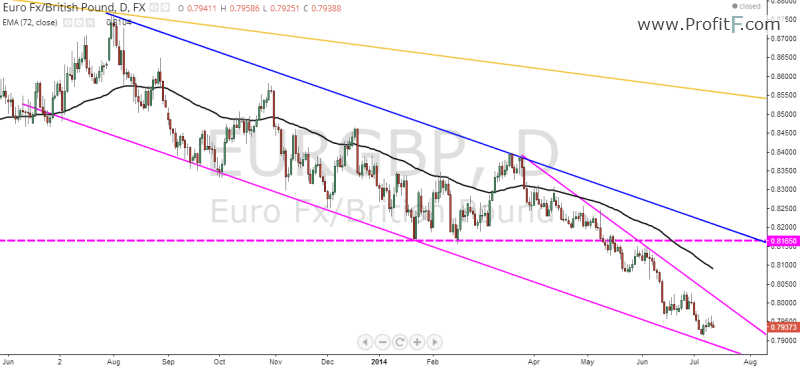
At daily chart we can use a parallel line of the weekly downtrend line to create a channel. We can’t use Fibonacci until the price break the daily downtrend line. So a retraction this week breaking the trend line may create good levels to be watched.
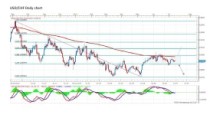
GBP/USD Weekly Forecast
Monthly Chart:
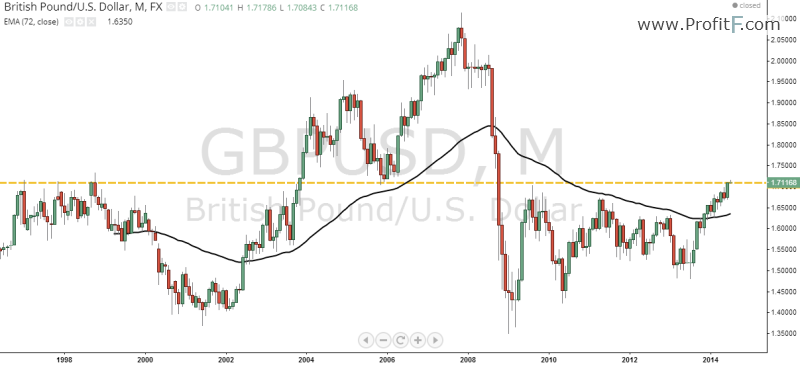
The price is at a area of strong resistance looking at the monthly chart. The area around 1.7100 was used as support and resistance many times in the past.
Weekly Chart:
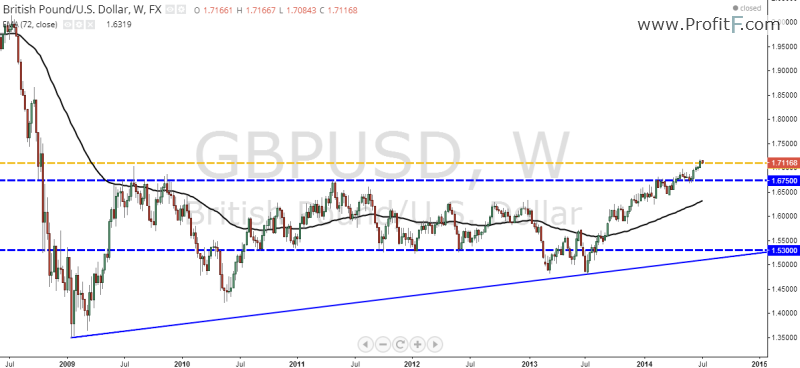
At weekly chart we see the price have a support level to hold he if he was not able to break the 1.7100 resistance, there is a support level at 1.5300 and a uptrend line but both is far away from the actual price.
Daily Chart:
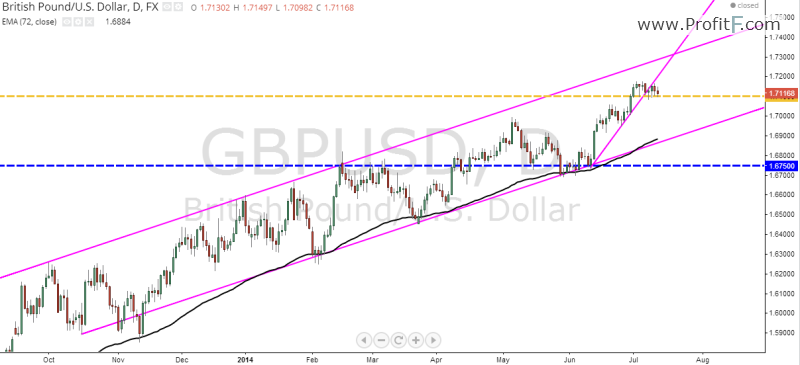
At daily chart the price is inside a channel. Last week he stood around 1.7100 without strength to keep rising. The uptrend line of the last movement was broke and now a retraction will able us to use the Fibonacci retraction to watch areas to buy next week.
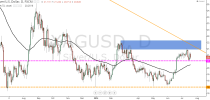
USD/SGD Weekly Forecast
Monthly Chart:
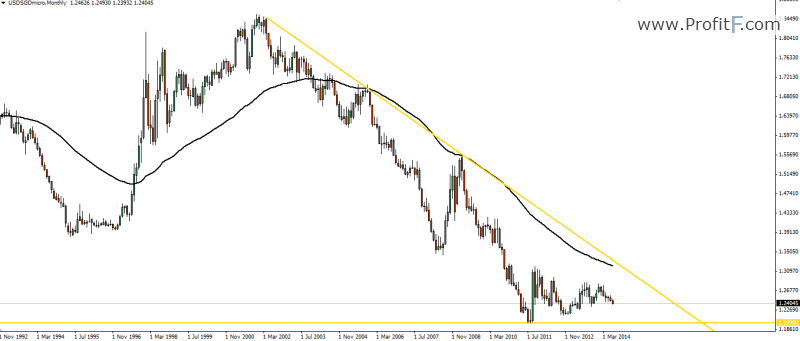
At monthly chart we can see the main trend for this pair really strong. We have two things to care about, the downtrend line and the last historical low at 1.1990.
Weekly Chart:
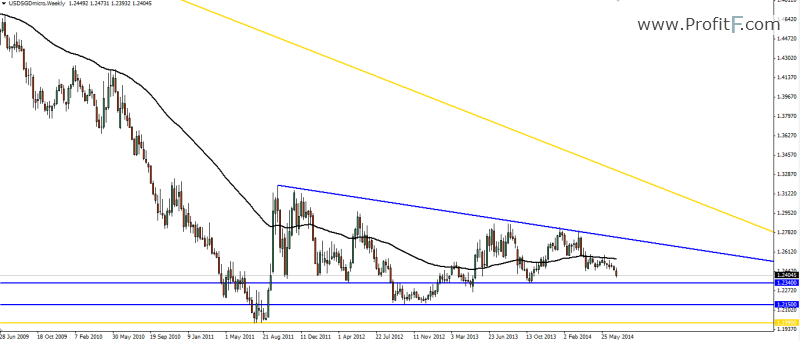
At weekly chart we see the price is close to a support area. The area between 1.21500 and 1.23400 is a strong support area. But the price is slowly trying it break this area, the downtrend line tell us this.
Daily Chart:
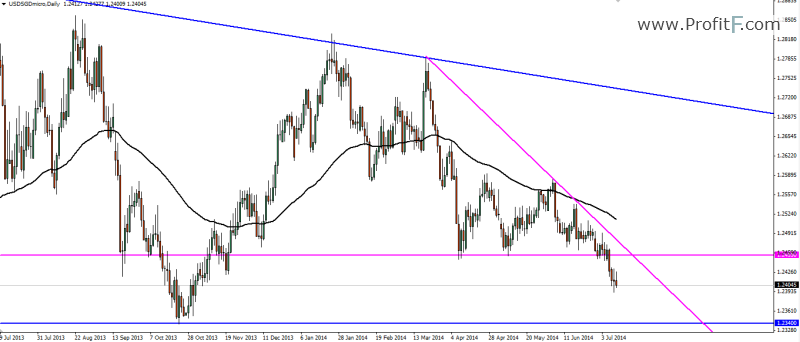
At daily chart we can see who last week the price broke a support level at 1.2455. A downtrend line is formed and a retraction to the resistance level may generate good signals to sell this week.
Gold Weekly Forecast
Monthly Chart:
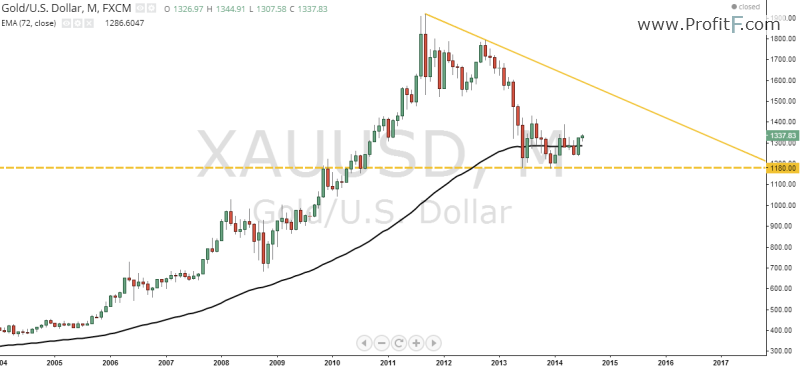
At monthly chart we must care about two things, the support level at 1180 who hold the price two times at last months and the downtrend line who is far away from the actual price.
Weekly Chart:
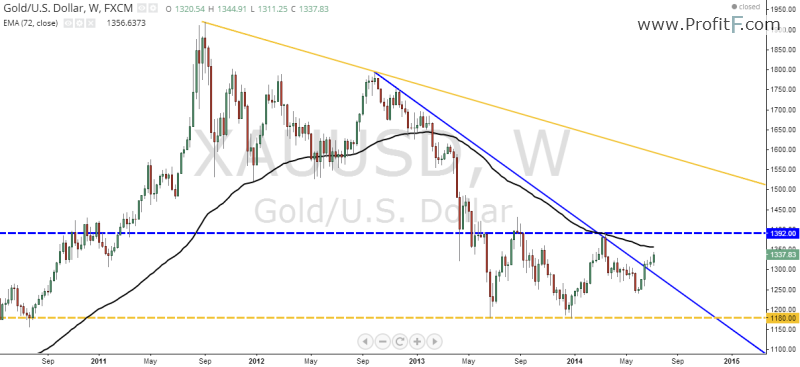
At weekly chart we can see one important up signal, the broken downtrend line. There is a resistance area around 1392 where the price is approaching. And the EMA 72 acted as resistance some weeks ago but the price failed to make a new low after that.
Daily Chart:
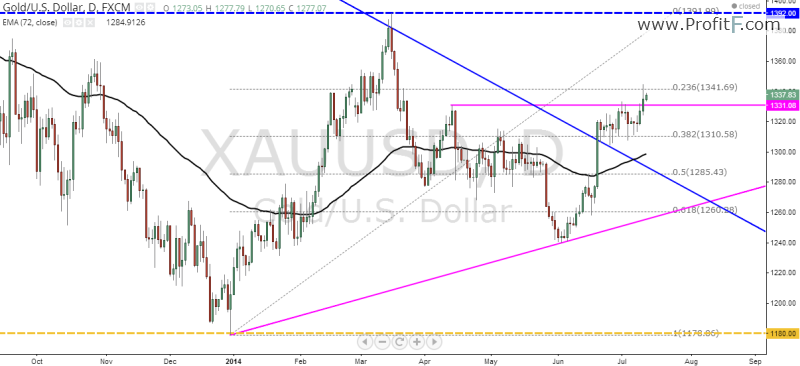
At daily chart we see the price has done a retraction to around 61.8% and started up again. He found resistance at the last top but now after he broke this level may be he is looking to reach the weekly resistance level.
————————————————
 (No Ratings Yet)