
Good opportunities for entry next week. Forex Weekly Technical Analysis based on the Support, Resistance levels, Trend lines, EMA. (Forex weekly forecast by Camilo R.)
Helpfull links: Real Time Forex Charts (Live), Forex Economic Calendar news (Live)
CHFJPY, EURAUD, GBPUSD, USDCAD
CHF/JPY Weekly Forecast
Monthly Chart:

At monthly chart we must care about 2 zones. The historical high at 119.170 and the support area around 105.000.
Weekly Chart:
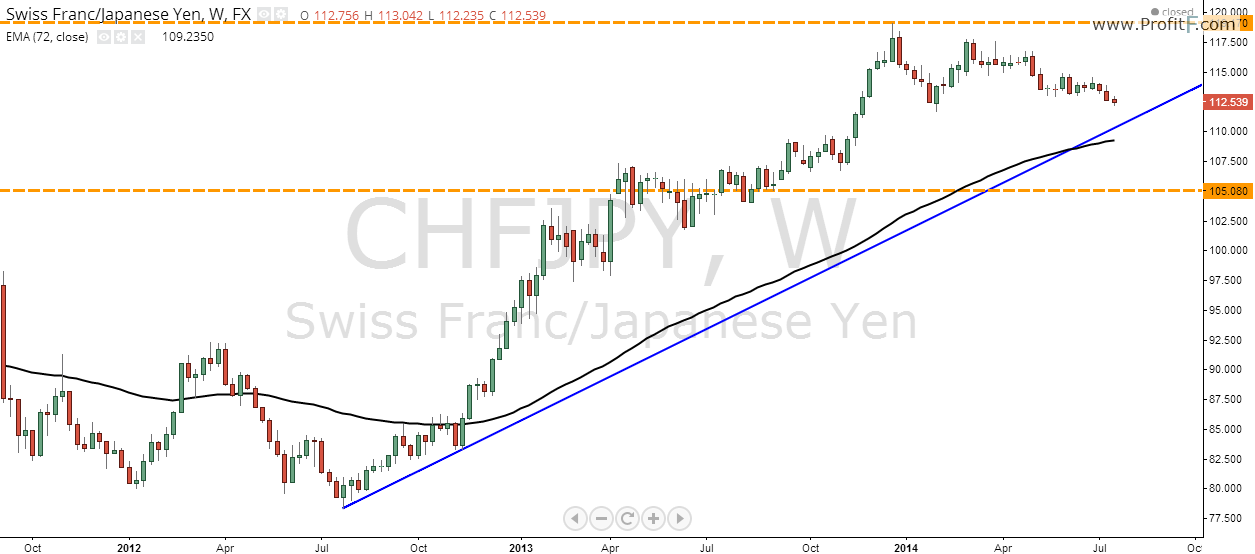
The weekly chart show us a uptrend line where the price is approaching.
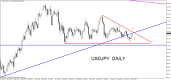
Daily Chart:
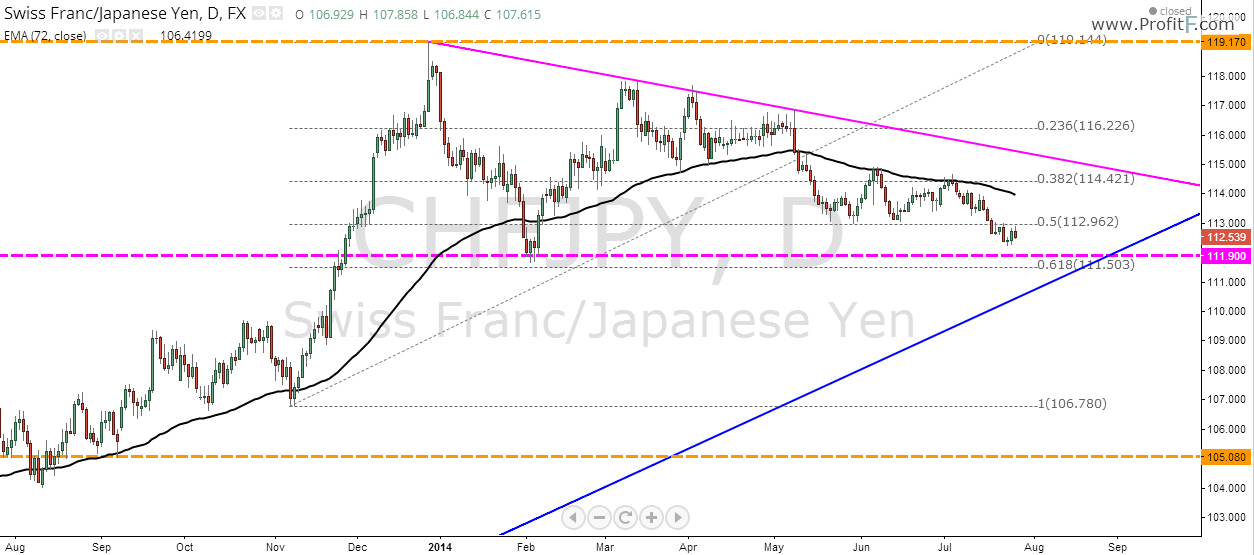
At daily chart we see the price done the retraction around 61.8% of the last Fibonacci but did not have the strength to break the last top. Now he is in a triangle. The weekly trend line may decide for where this pair will go.
EUR/AUD Weekly Forecast
Monthly Chart:
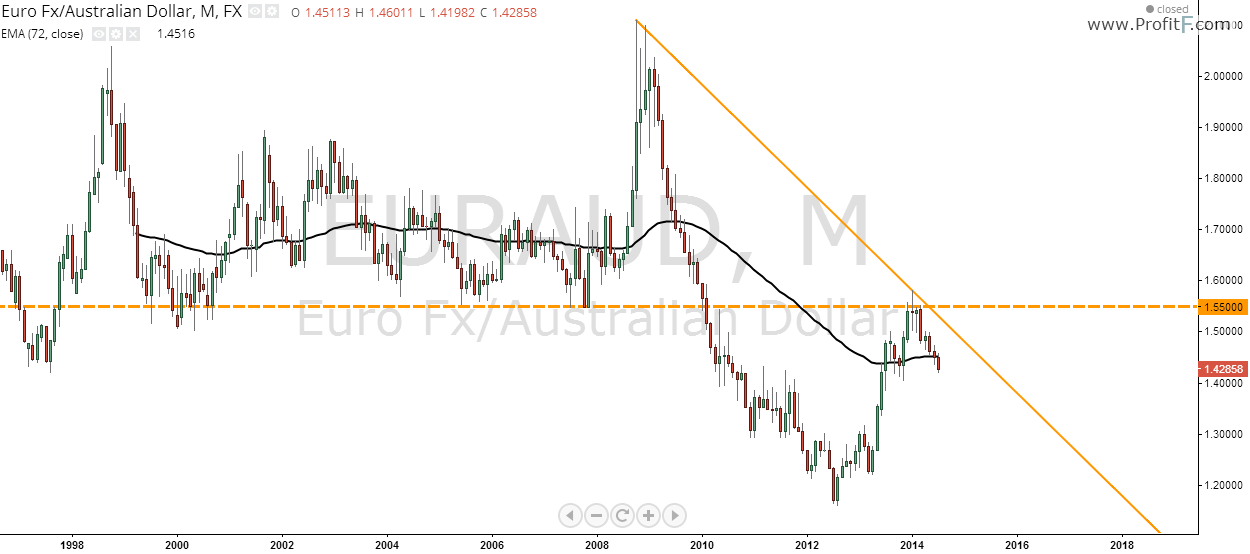
At monthly chart we can see a recently formed downtrend line and a resistance area around 1.5500 retested.
Weekly Chart:
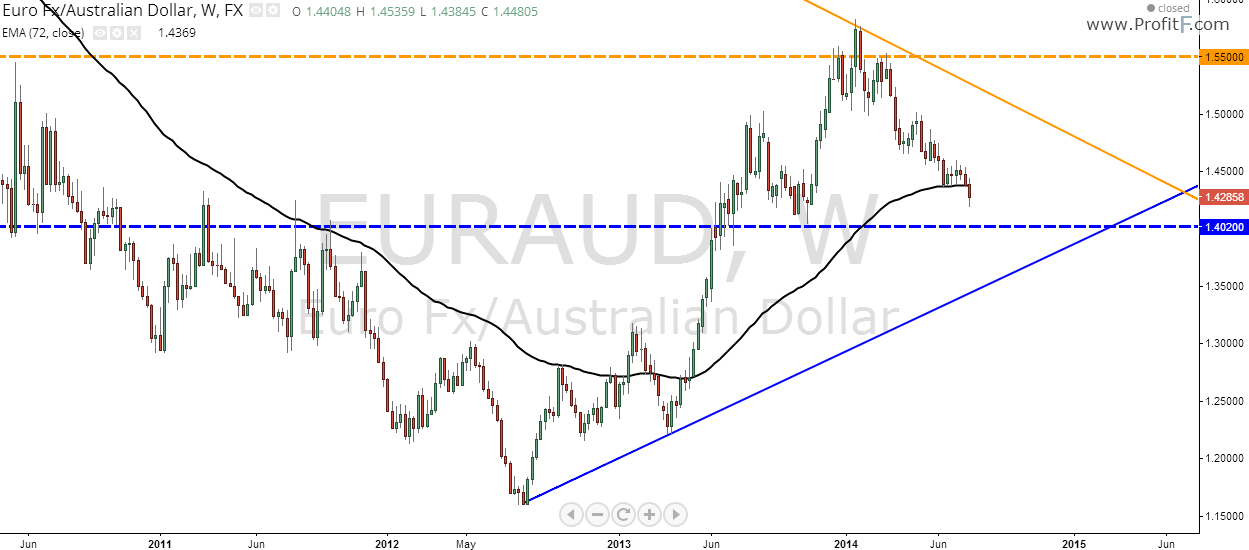
At weekly chart we must care about the support area around 1.4020 and the uptrend line, the price already broke the EMA72.
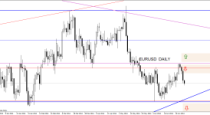
Daily Chart:

The daily chart show us a down channel formed. The price broke a support area around 1.4520 and retested this zone some times before down again, probably now he only will find support around 1.4020.
GBP/USD Weekly Forecast
Monthly Chart:
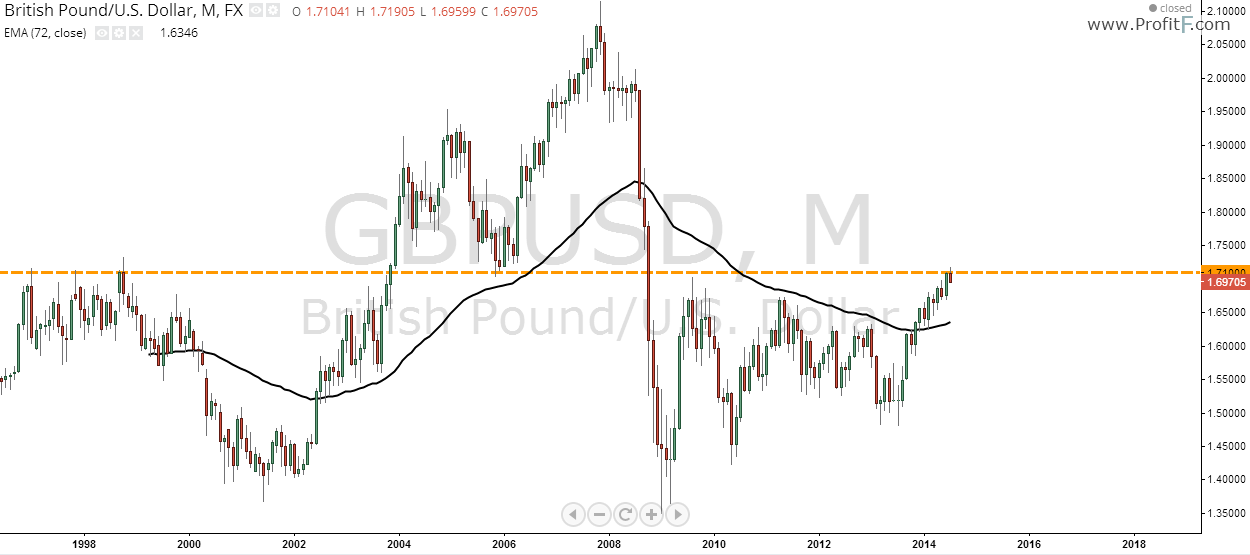
At monthly chart we can see the price found support at the 1.7100 area.
Weekly Chart:
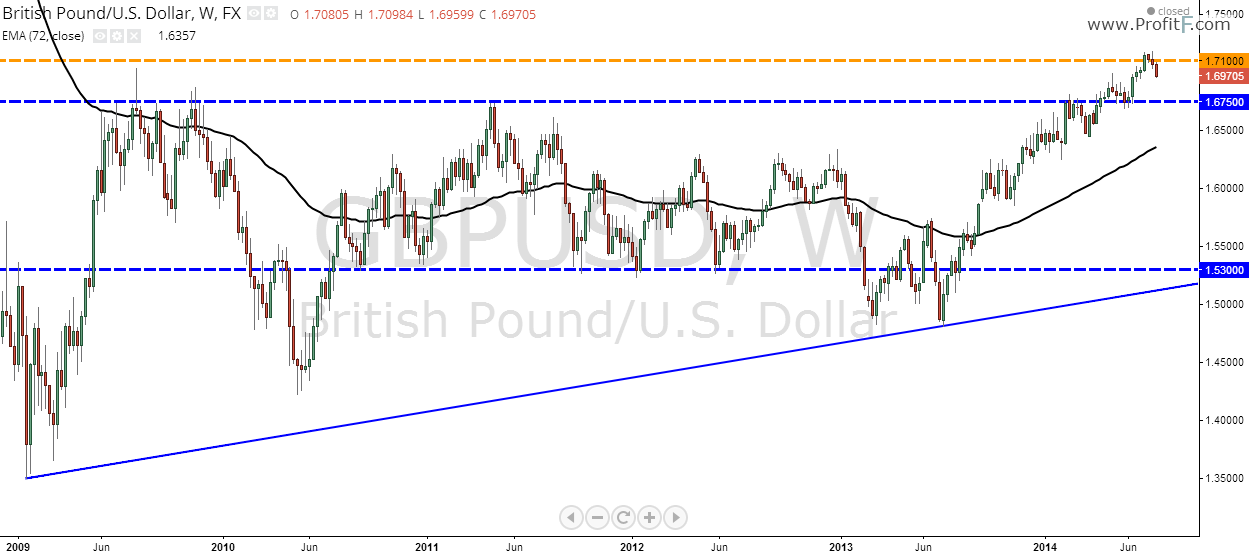
At weekly chart we see a up trend line and two support zones around 1.5300 and 1.6750. In this chart we see the price is without a strong retraction since 07/2013 we must be ready for this seeing that the price touched an area of monthly resistance.
Daily Chart:
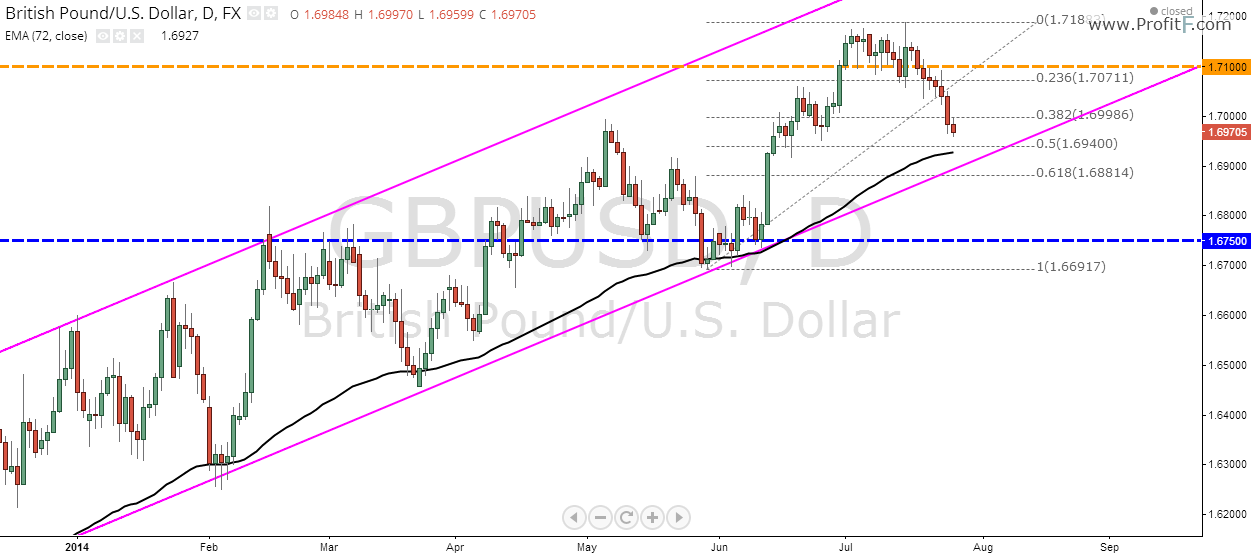
The price at daily chart is in a up channel. He is doing a retraction and the area around 50% is looking promising, a price action confirmation may generate good buy orders.
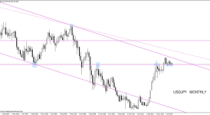
USD/CAD Weekly Forecast
Monthly Chart:
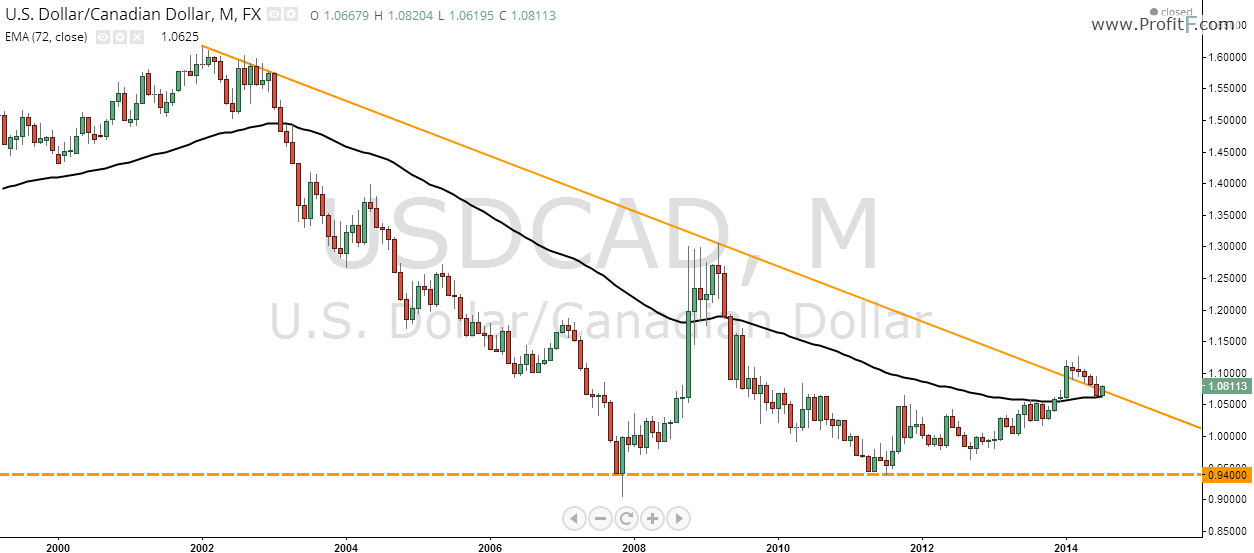
At monthly chart we can see a support area around 0.9400 and a downtrend line being broken.
Weekly Chart:

At weekly chart we see the price touched the strong support area around 1.060 in confluence with the uptrend line, EMA72 and broke the monthly trend line.
Daily Chart:

At daily chart we can see the price finally broke the downtrend line. After this broke the EMA72 don’t will hold the price, so probably now the price don’t will find resistance before the last high. This may be a good opportunity to buy this pair.
 (No Ratings Yet)

Add your review