
With all eyes turned ON the greek crisis, the euro is now driven by fundamentals. what is happening now with the yen pairs is from a technical point of view quite interesting.
1 THE YEN PAIRS : A TURNING POINT ?
I will be rather looking to sell rallies on USDJPY 4hr chart as long as we remain under 121. 115,5 is however a strong support level that will be tough to break.
The bullish trend on USDJPY has been now lasting for six months, but the pair is now showing signs of weakness while other yen crosses will soon be entering strong resistance areas.
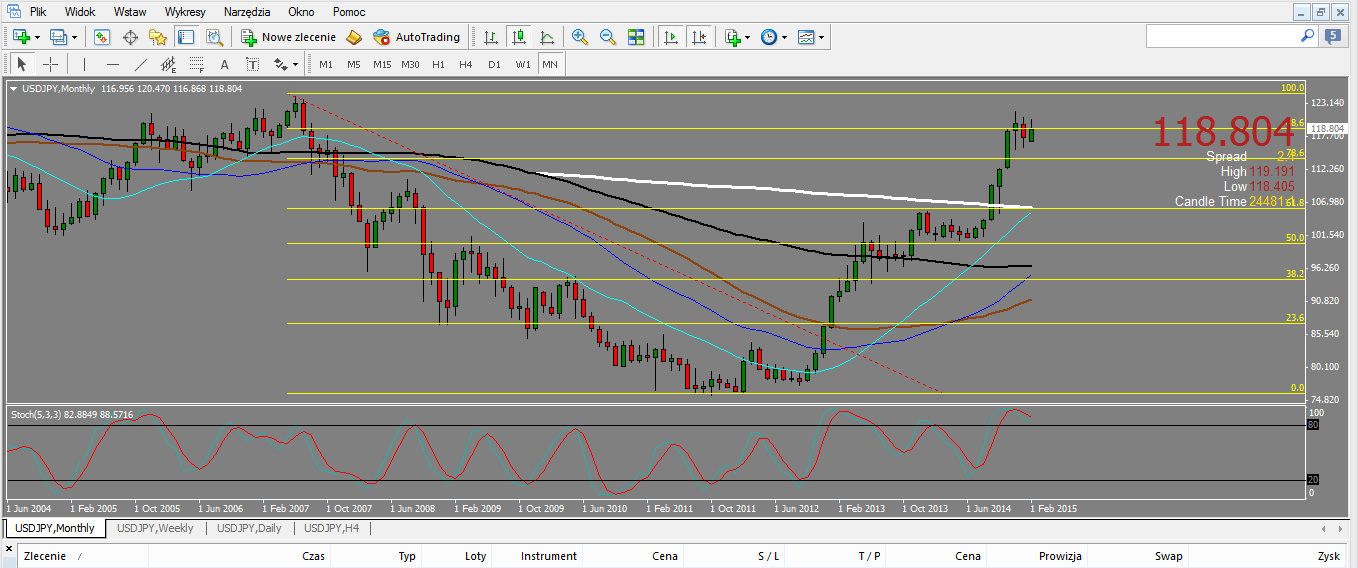
On the USDJPY monthly chart, last month’s candle was a bearish one, that retested and broke down a fibonacci 0,886 line support around 119. The pair is now testing it once again as a resistance, but the current candle’s upwick suggests it has trouble with it.
All Screenshots are CLICKABLE!
USDJPY MONTHLY CHART:
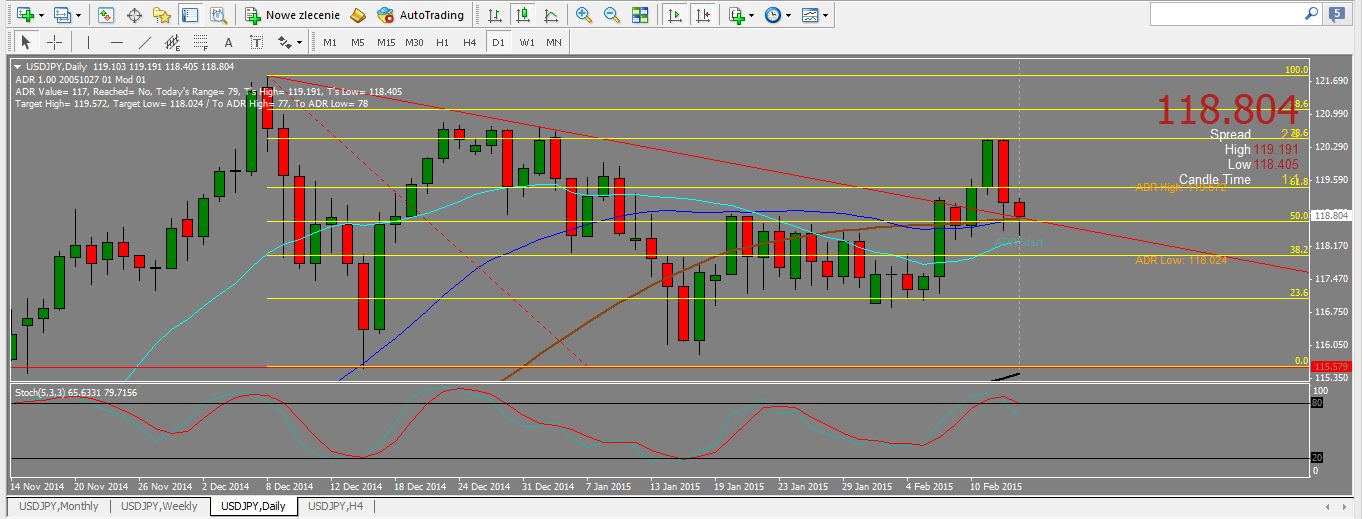
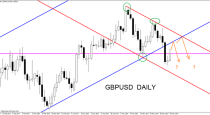
On the daily chart, The pair was ranging in a triangle, then made a strong bullish break out of it, reaching 120,4 before turning back (bearish engulfing candle), It is now retesting that broken TL as a support. Friday’s candle was a bearish one, but very weak ; it somehow rejected the broken trendline support, but did not show any sign the bulls are back into control either. Please note the strong confluence of five supports at that level : three SMAs (SMA55, SMA40 and SMA20) a 50 fib line, and the triangle’s upper trendline. Yet, it seems the pair cannot gather the strength to really bounce back.
USDJPY DAILY CHART:
Now if you take a quick look at several other yen pairs
EURJPY MONTHLY CHART:

We are retesting the inner branch of a W around 136. On the weekly chart (not shown), the pair broke down and is retesting the SMA100 resistance around 136,5. Two strong resistances
GBPJPY MONTHLY CHART:
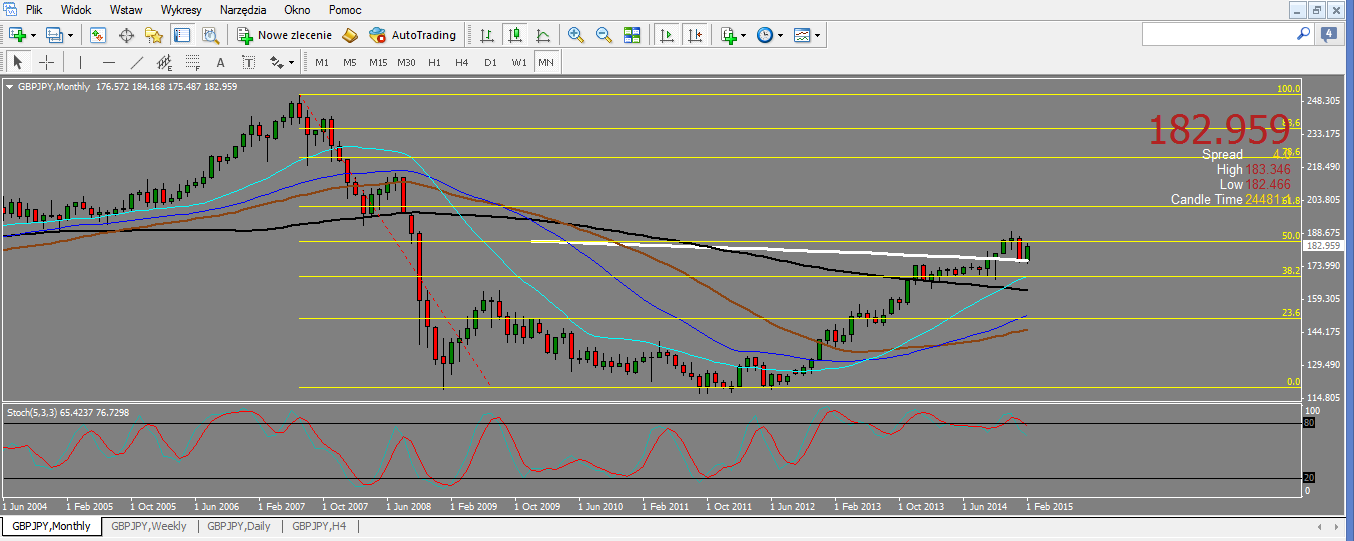
The pair is retesting a 50 fib line, broken support now resistance. That should prove resistive.
AUDJPY MONTHLY CHART:

We are retesting a fib line, together with the monthly SMA20 at 93,8 -94. Note how the pair reacted at that level. It was a strong support, it should be a strong resistance.
Those setups are red from monthly charts. They make take some time to develop, but keep those resistances in mind while trading this week.
2 A QUICK LOOK AT AUDNZD.
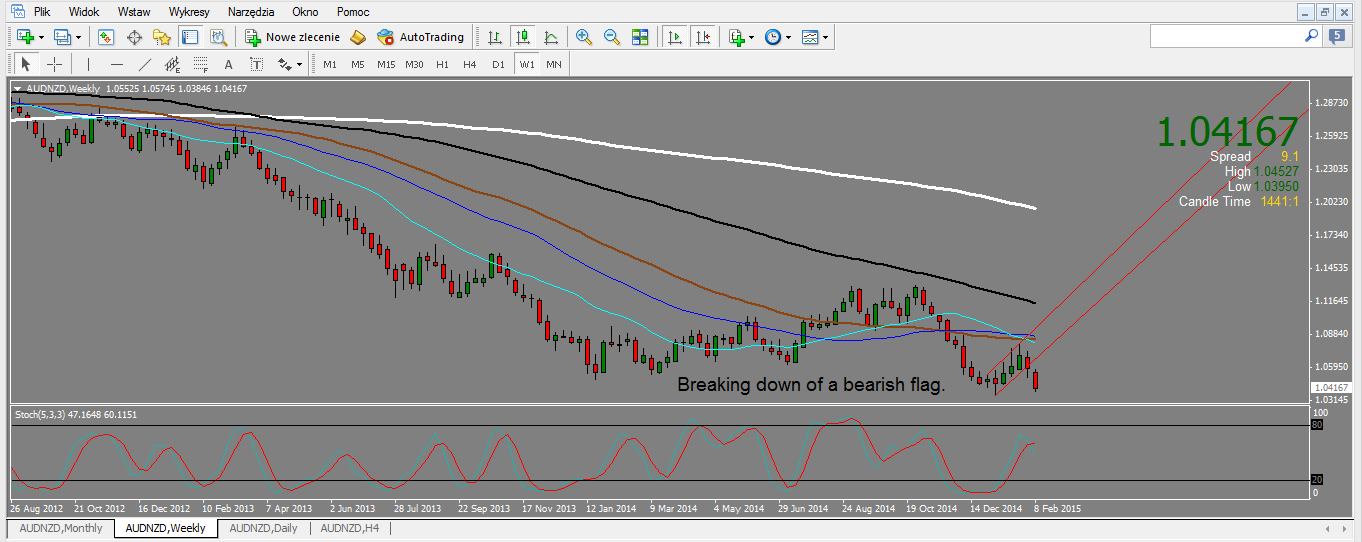
Despite being near an all-time low, I will short a confirmed bearish break out of 1,04. I will start to look for longs if we manage to break and stay above 1,045.
AUDNZD is currently testing an all time lows, and we should normally look for bullish reversals. But on the weekly, we can see the pair is breaking down a bearish flag with a 900 pips pole.
The daily chart shows us a potential double bottom on the ,886 fib support level (also 1,04 psychological level). But the last candle also looks like we are failing at retesting the resistance of 1,042 previous daily low.
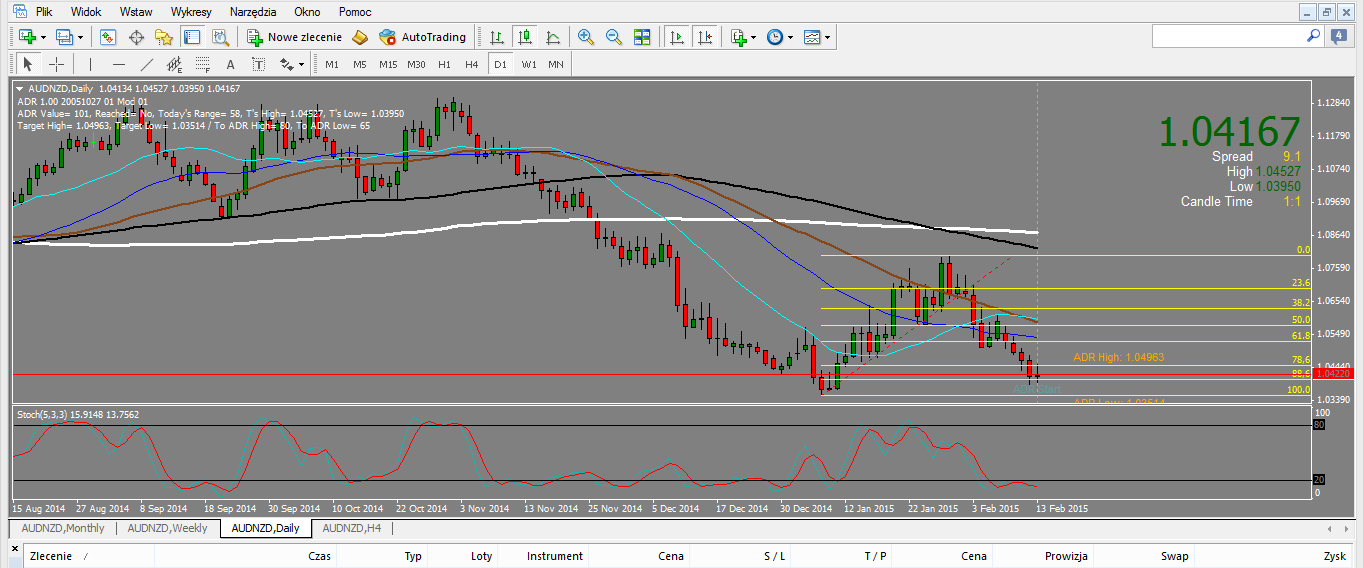
Taking into account the weekly bearish flag break out, I will short a confirmed break out of 1,04, but will be a buyer if the pair manages to make a bullish break out of ,786 fib resistance around 1,045.
 (No Ratings Yet)
Add your review