
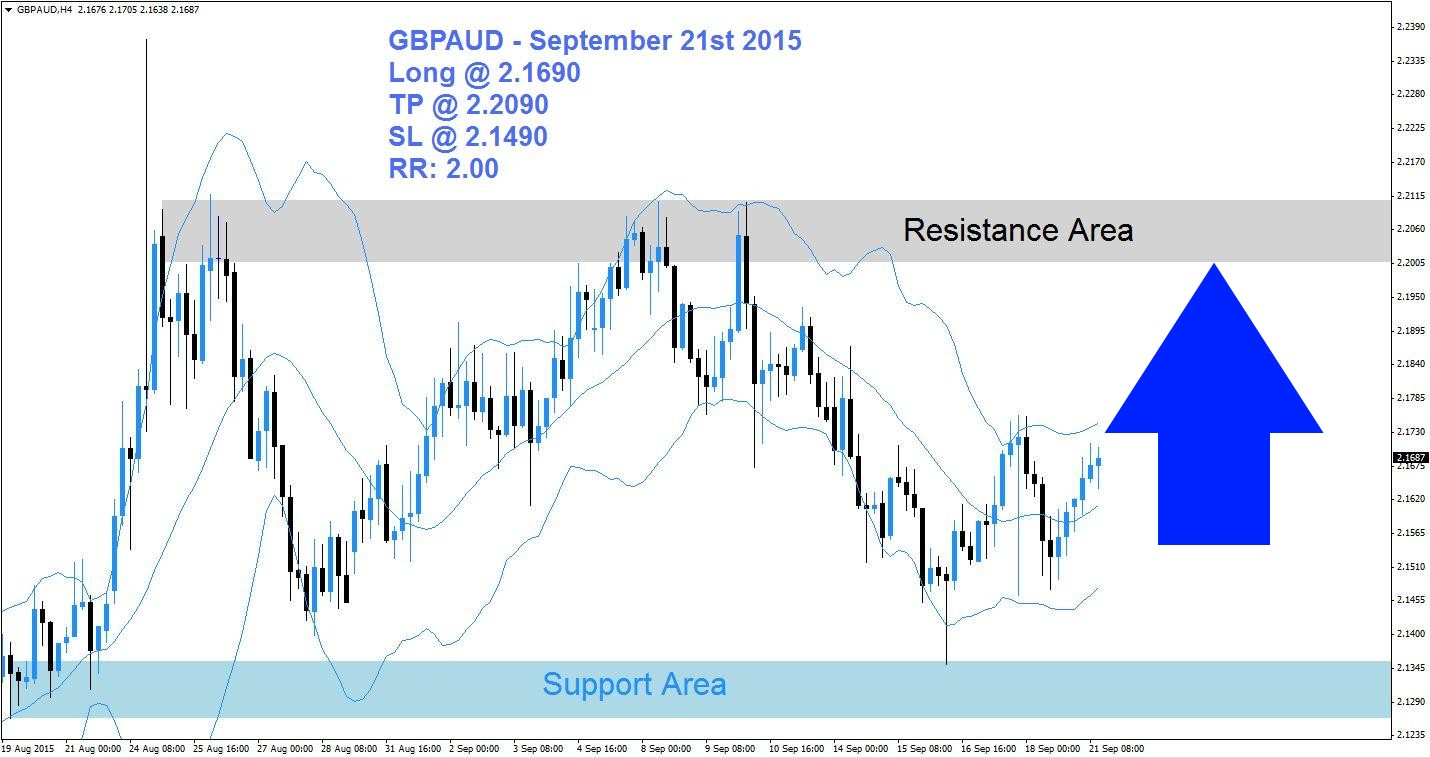
The GBPAUD has been confined to a tight trading range over the past few trading sessions. The upper end of its trading range is marked by its resistance area visible in light grey in the above H4 chart and the lower end is visible by its support area which is marked in light blue. The Bollinger Band indicator confirms the trading range and is located in the middle of it. All three bands have started to slope to the upside.
This currency pair is currently advancing and expected to reach its resistance area. Forex traders have already started to close short-positions following the breakout above the middle band of the Bollinger Band indicator. The short-covering rally is likely to push the GBPAUD further to the upside as long as price action remains above the middle Bollinger Band which supports the rally. A breakout above the trading range is not expected.
Forex traders are advised to seek long positions at 2.1690 and below this level which will position their trading accounts to profit from the expected continuation of the short-covering rally. A take profit target of 2.2090 has been set for a potential trading profit of 400 pips on the H4 Chart. More buy orders are expected in the GBPAUD the longer price action will trade between the middle band and the upper band of the Bollinger Band indicator.
Forex traders should protect this trade with a stop loss level at 2.1490 for a potential trading loss of 200 pips which will result in a Risk-Reward (RR) ratio of 2.00.
GBPAUD
Long @ 2.1690
TP @ 2.2090
SL @ 2.1490
RR: 2.00
 (No Ratings Yet)
Add your review