

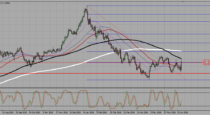
The GBPAUD has endured some choppy trading over the past few sessions as it initially rallied from its support area, which is drawn on light blue in the above H4 chart, to its resistance area, visible in light grey. A sharp sell-off followed which dropped this currency pair into a roughly 50% retracement from where another strong rally formed which took the GBPAUD back into its resistance area; a double top formation was created as a result and ore bearishness can be expected going forward.
A sideways trend is likely which can give the Bollinger Band indicator time to reflect the volatile trade. Currently the upper band as well as the middle band is sloping upwards which indicates upside, but given that the Bollinger Band indicator is a lagging indicator this reflect the sharp rally after the retracement. The lower band has already started to trade sideways with a bearish bias which suggests that the next move in the GBPAUD will be to the downside.
Forex traders are recommended enter short positions above 2.0045 in order to take advantage of the expected sell-off. Once the GBPAUD will break down below the middle band of its Bollinger Band indicator an increase in selling pressure is expected to follow. Conservative forex traders may wish to wait for the breakdown before entering this recommended trade. A take profit target of 1.9395 has been selected for a potential profit of 650 pips.
Forex traders should protect this trade with a stop loss level at 2.0045 for a potential trading loss of 200 pips which will result in a Risk-Reward (RR) ratio of 3.25.
GBPAUD
Short @ 2.0045
TP @ 1.9395
SL @ 2.0045
RR: 3.25
 (No Ratings Yet)
hi all, you can subscribe to this analysis here https://feedburner.google.com/fb/a/mailverify?uri=ProfitfJohnu&loc=en_US For FREE 😉