
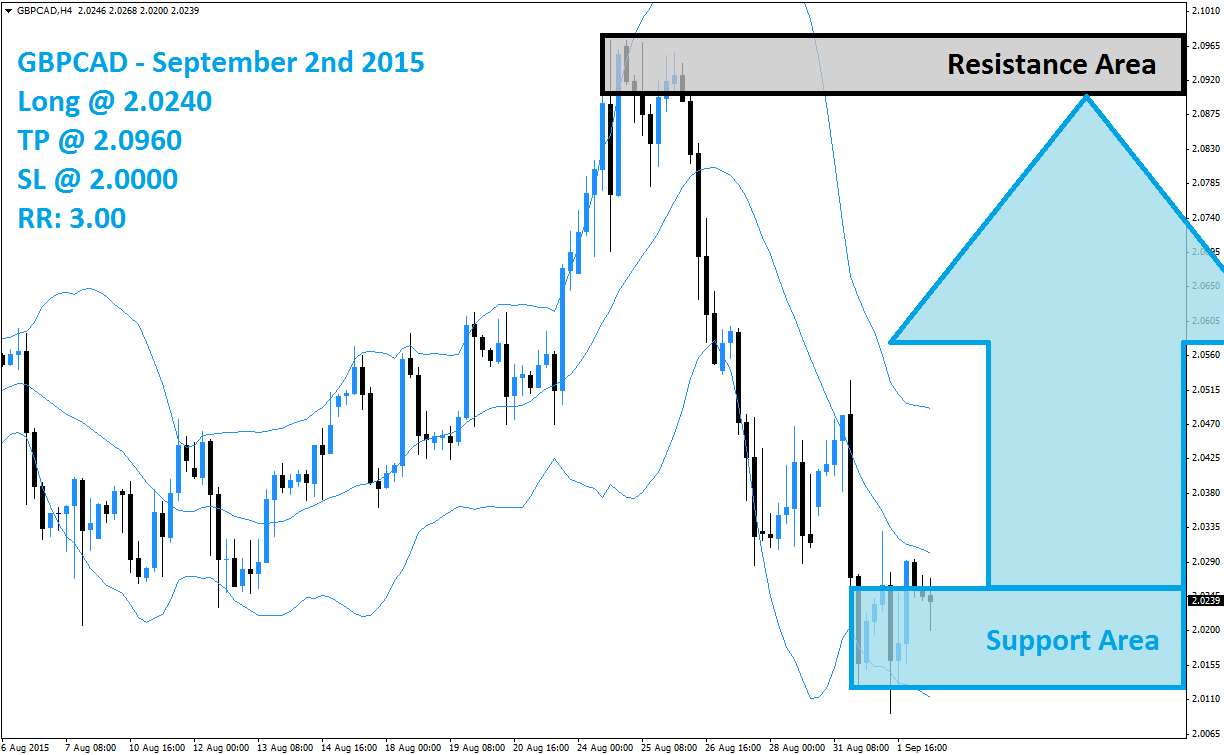
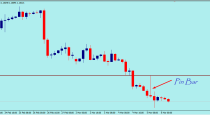
The GBPCAD sold off from its resistance area which is visible in light grey in the above H4 chart and has now reached its support area, marked in light blue. The low which was set by the sell-off was slightly lower than the previous low from where the GBPCAD rallied into its resistance area. A sideways trend could develop next until the next catalyst for a bigger move will be provided. This currency pair is not expected to break-down below its support area.
The Bollinger Band indicator has support the sell-off with all three bands sloping to the downside. Price action is currently trading between the lower band and the middle band of the Bollinger Band indicator; both bands have enclosed the support area. Forex traders may decide to realize floating trading profits and close their short positons which will lead to a short-covering rally. This could push the GBPCAD above the middle band of its Bollinger Band indicator.
Forex traders are recommended to enter long positions at 2.0240 and below this level which will position their trading accounts to profit from the expected short-covering rally. Conservative forex traders should wait for a breakout above the middle band of it Bollinger Band indicator before entering their long positions. A take profit target of 2.0960 has been set for a potential trading profit of 720 pips on the H4 Chart. More buy orders are expected after the GBPCAD completes its breakout above the middle Bollinger Band.
Forex traders should protect this trade with a stop loss level at 2.000 for a potential trading loss of 240 pips which will result in a Risk-Reward (RR) ratio of 3.00.
GBPCAD
Long @ 2.0240
TP @ 2.0960
SL @ 2.0000
RR: 3.00
 (No Ratings Yet)
Add your review