
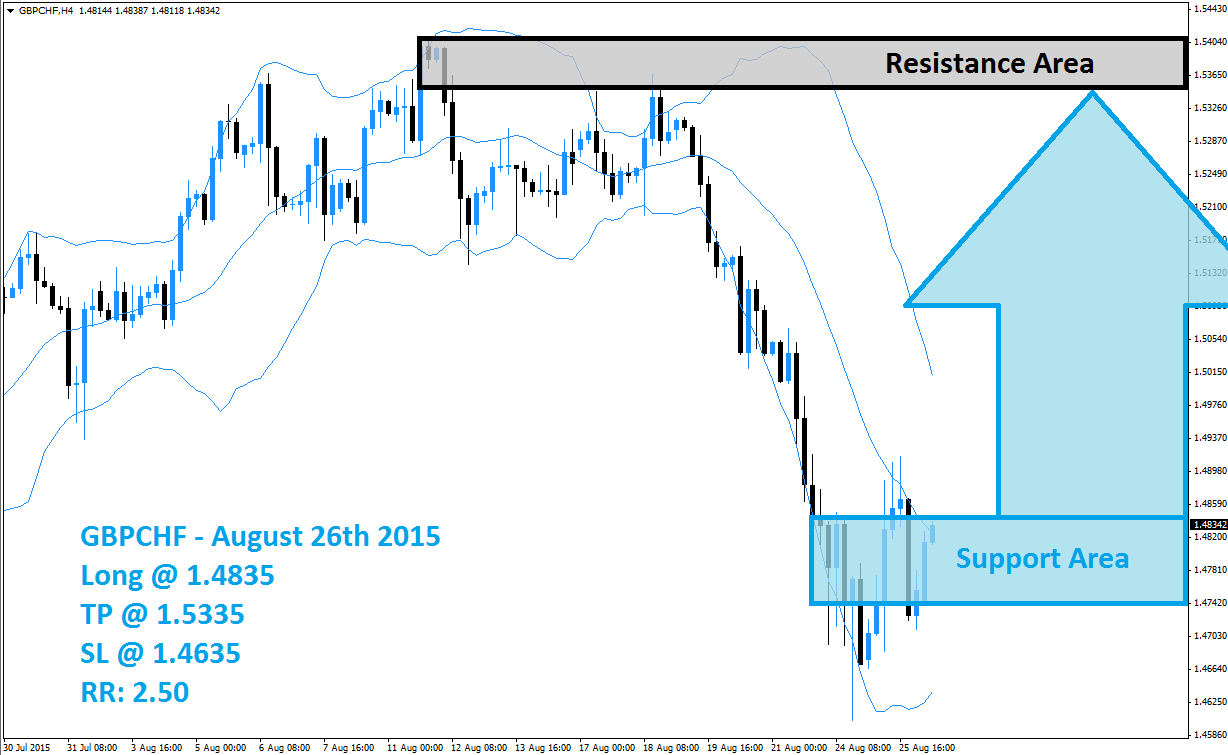
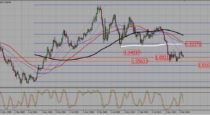
The GBPCHF has enter a strong sell-off from its resistance area, visible in light grey in the above H4 chart, which took this currency pair down to its support area marked in light blue. After a breakout below its support area the GBPCHF was able to recover and this currency pair is now searching for direction. The lack of a fundamental reason for the sell-off to continue leaves this currency pair open for a short-covering rally.
Forex traders may opt to lock in profits after the strong sell-off and realize floating trading profits by exiting their short positions. This could push the GBPCHF above the middle band of its Bollinger Band indicator and materialize into a bigger advance. The lower band of the Bollinger Band indicator has bottomed out below of its support area, but price action remains below the middle band which has now reached its support area.
Forex traders are advised to enter long positions at 1.4835 and below this level; this will position their trading accounts to profit from the expected short-covering rally. Conservative forex traders should wait for a breakout above the middle band of it Bollinger Band indicator before entering their long positions. A take profit target of 1.5335 has been set for a potential trading profit of 500 pips on the H4 Chart. More buy orders are expected after the GBPCHF completes its breakout above the middle Bollinger Band.
Forex traders should protect this trade with a stop loss level at 1.4635 for a potential trading loss of 200 pips which will result in a Risk-Reward (RR) ratio of 2.50.
GBPCHF
Long @ 1.4835
TP @ 1.5335
SL @ 1.4635
RR: 2.50
 (No Ratings Yet)
Add your review