
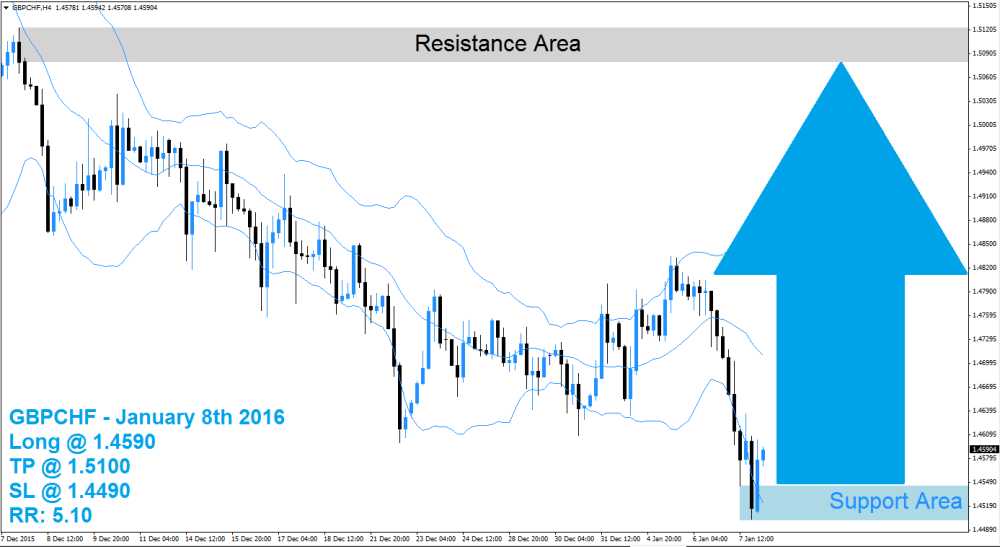
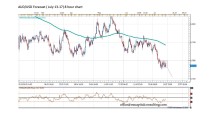
The GBPCHF sold off from the upper Bollinger Band into its support area which is marked in light blue in the above H4 chart. Once it reached the low end of its support area this currency pair was able to bounce higher and is now trading above its support area and between the lower band and the middle band of the Bollinger Band indicator. All three bands are currently sloping lower following the sharp drop in the GBPCHF.
The move above its support are could result in forex traders realizing floating trading profits by closing short positions. This will lead to a short-covering rally which can push this currency pair above the middle Bollinger Band from where new net long positions are likely to follow. The expected rally has room to run until this currency pair will reach its resistance area visible in light grey from where a new analysis is recommended.
Forex traders are recommended to enter long positions at 1.4590 and below this level in order to take advantage from the expected short-covering rally. Conservative forex traders should wait for a breakout above the middle band of it Bollinger Band indicator before entering their long positions. A take profit target of 1.5100 has been set for a potential trading profit of 510 pips on the H4 Chart. More buy orders are expected after the GBPCHF completes its breakout above the middle Bollinger Band.
Forex traders should protect this trade with a stop loss level at 1.4490 for a potential trading loss of 100 pips which will result in a Risk-Reward (RR) ratio of 5.10.
GBPCHF
Long @ 1.4590
TP @ 1.5100
SL @ 1.4490
RR: 5.10

 (1 votes, average: 4.00 out of 5)
Add your review