
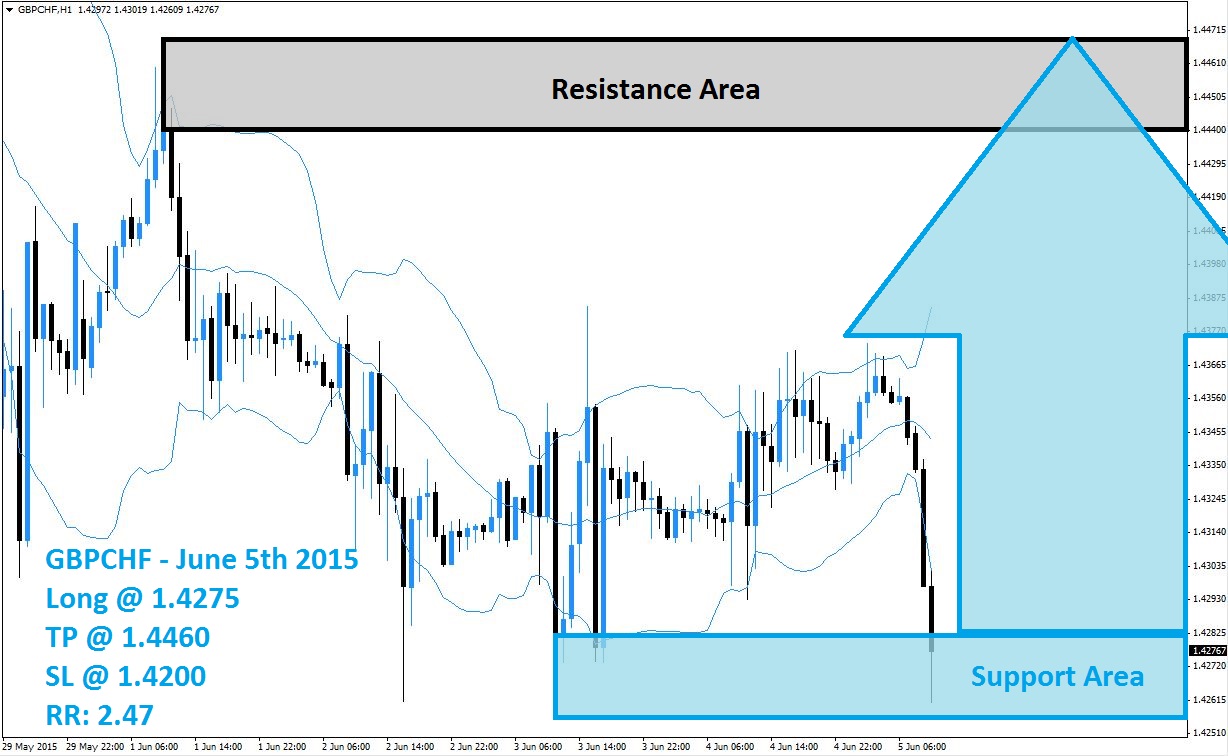
The GBPCHF has plunged during yesterday’s trading session after a failed breakout attempt above its Bollinger Band indicator. This has taken the GBPCHF back down to its support area which is visible in light blue in the above H1 chart. The sell-off was not strong enough to result in a breakdown below its support area and this currency pair may attempt to launch a quick reversal. The latest H1 candlestick has the potential to form a hammer which would be a bullish sign.
Forex traders may opt to realize floating trading profits after the short sell-off which will lead to a short-covering rally. The upper Bollinger Band continues to favor an uptrend, while the middle and lower Bollinger bands are favoring a downtrend. This is likely to reverse quickly as the GBPCHF is expected to rally from its support area back into its resistance area which is visible in light grey in the above chart.
Forex traders are recommended to seek out long positions in the GBPCHF at 1.4275 and below in order to position their trading accounts for the expected short-covering rally. More conservative traders are advised to wait for the breakout above its support area before taking long positions. A take profit target of 1.4460 has been set for a potential trading profit of 185 pips on the H1 Chart. An increase in buy order sis expected once the USDCHF breaks out above its support area.
Forex traders should protect this trade with a stop loss level at 1.422 for a potential trading loss of 75 pips which will result in a Risk-Reward (RR) ratio of 2.47.
GBPCHF
Long @ 1.4275
TP @ 1.4460
SL @ 1.4200
RR: 2.47
 (No Ratings Yet)
Add your review