
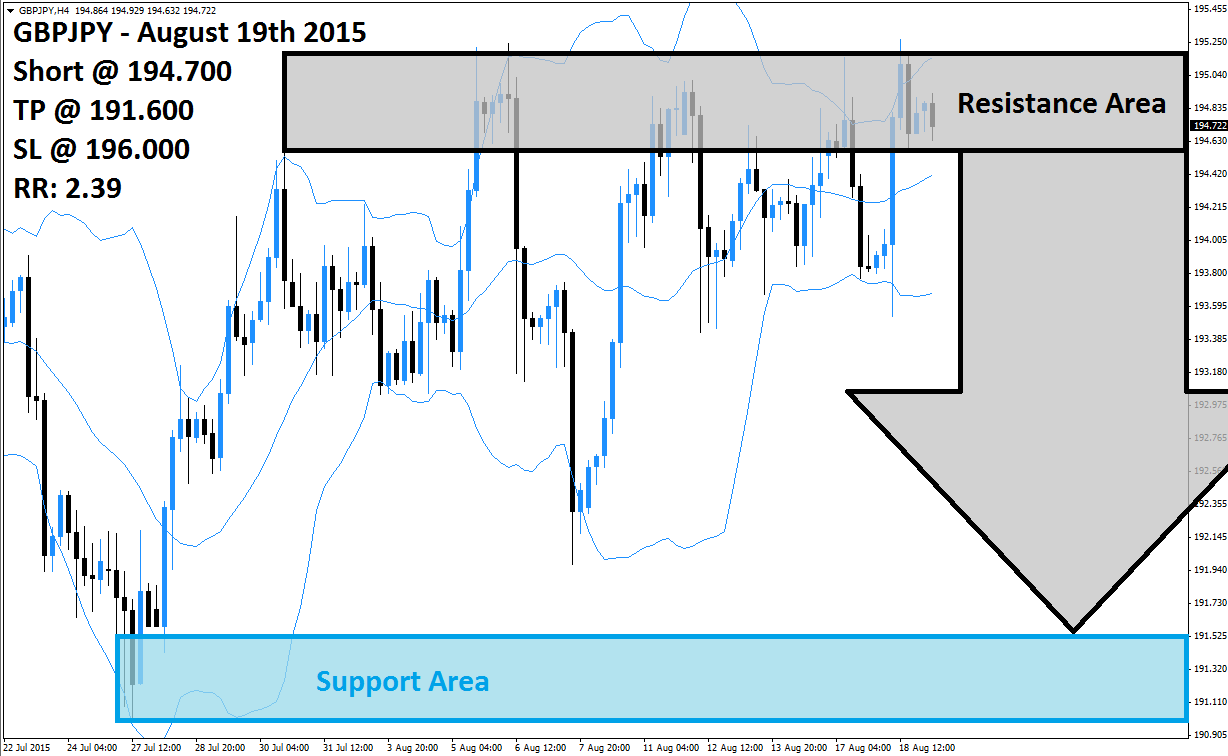
The GBPJPY has rallied from a previous sell-off low which took this currency pair down to the lower band of its Bollinger Band indicator. A short-covering rally followed and the GBPJPY is trading back inside of its resistance area which is marked in light grey in the above H4 chart. This currency pair has formed a double top formation which is a bearish chart pattern and expected to result in another sell-off fueled by profit taking.
The upper band of its Bollinger Band indicator is trading inside of its resistance area and together with the double top formation this may be enough to convince forex traders to realize floating trading profits. Price action is trading between the middle band, which is trading below its resistance area, and the upper band; a breakdown below the middle band is expected to further increase selling in this currency pair.
Forex traders are advised to seek short entries at 194.700 and above in order to position their forex trading portfolios for the expected sell-off in the GBPJPY. Conservative forex traders should wait for price action to break down below the middle band of its Bollinger Band Indicator as this would result in an increase in sell orders. A take profit target of 191.600 has been selected for a potential trading profit of 310 pips.
Forex traders should protect this trade with a stop loss level at 196.000 for a potential trading loss of 130 pips which will result in a Risk-Reward (RR) ratio of 2.39.
GBPJPY
Short @ 194.700
TP @ 191.600
SL @ 196.000
RR: 2.39

 (1 votes, average: 4.00 out of 5)
Add your review