
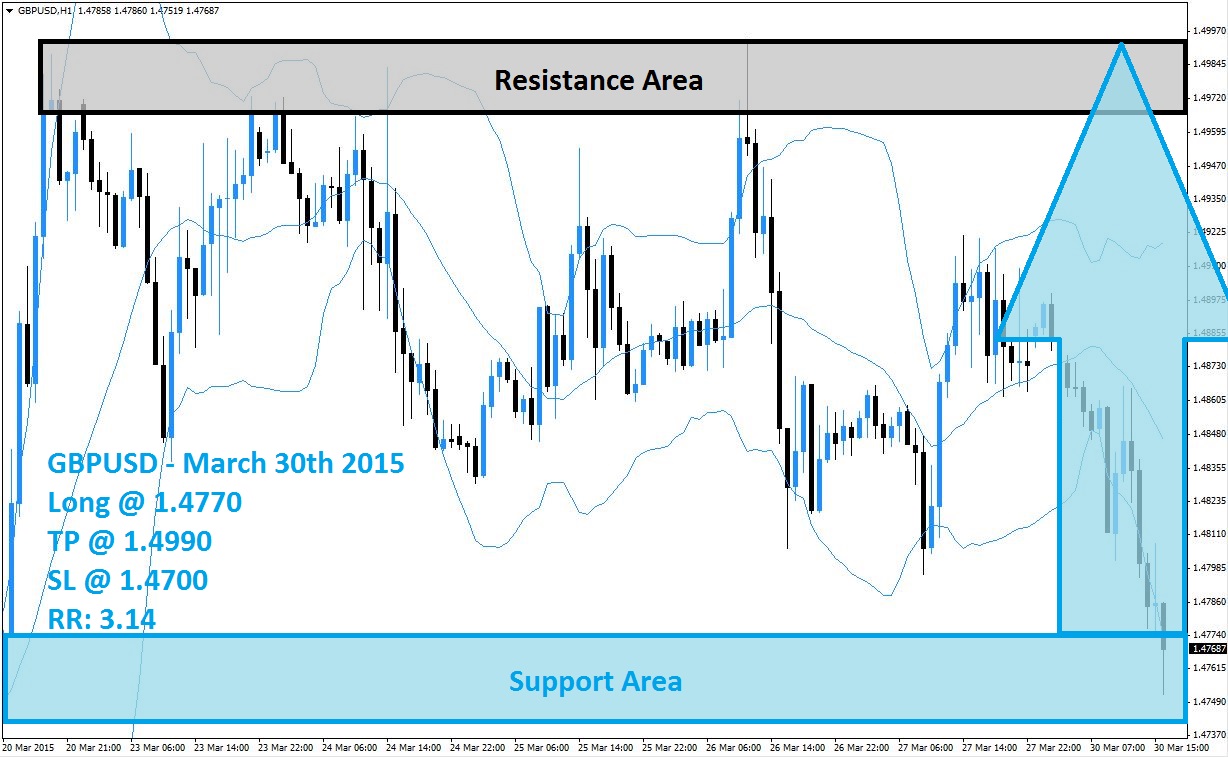
The GBPUSD sold off with another leg lower after a failed breakout above the top band of its Bollinger Band indicator increased downward pressure. This currency pair found support inside of its support area which is marked in light blue in the above H1 chart. The last H1 candlestick pattern offers a bullish trading signal as it is forming a hammer inside a very strong support area. Forex traders should expect price action to reverse from current levels.
A double bottom chart pattern (read more about this pattern) offers another bullish trading signal as the GBPUSD is expected to move back into its middle band of its Bollinger Band indicator which coincides with a medium resistance level which previously served as a support area. Upward momentum is expected to be strong enough to pressure the GBPUSD above this level. A short-covering rally is expected to initiate the turnaround as forex traders are likely to realize floating trading profits after a strong sell-off.
Once price action pushes through the middle band of its Bollinger Band indicator the GBPUSD is expected to accelerate back into its resistance area which is marked in grey in the above chart. Forex traders should look for long entry opportunities at 1.4770 and below. A take profit target of 1.4990 has been selected for a potential trading profit of 220 pips on the H1 Chart. Any dip below the 1.4770 mark should be taken advantage of and is expected to be short-lived
Forex traders should protect this trade with a stop loss level at 1.4700 for a potential trading loss of 70 pips which will result in a Risk-Reward (RR) ratio of 3.14.
GBPUSD
Long @ 1.4770
TP @ 1.4990
SL @ 1.4700
RR: 3.14
 (No Ratings Yet)
Add your review