
Subscribe to Updates (Weekly forex analysis by Stephen L) via Email
GBPUSD trading plan.
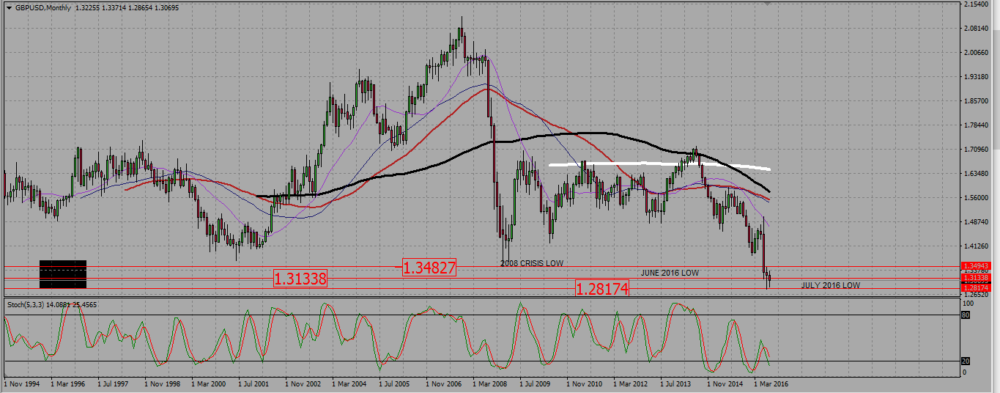
Watch the retest of the low of June 2016 around 1,315, and sell signals long term, or buy a bullish break out towards the low of the 2008 crisis near 1,35.
On the monthly chart, the pair bottomed around 1,28 in July, and this month candle is entirely included in the previous one, not unlike some kind of bullish harami.
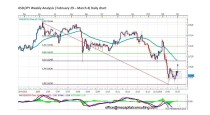
GBPUSD MONTHLY CHART.
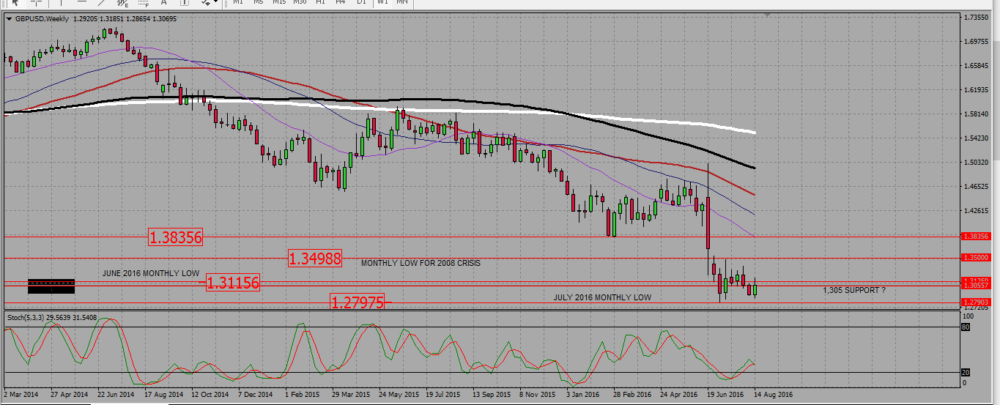
The weekly chart is bearish. After reaching the low at 1,28, the pair is ranging above it. This week candle is a bullish one that retests the low of June 2016 at 1,315. It has ab upwick, meaning some kind of undecision.
GBPUSD WEEKLY CHART.
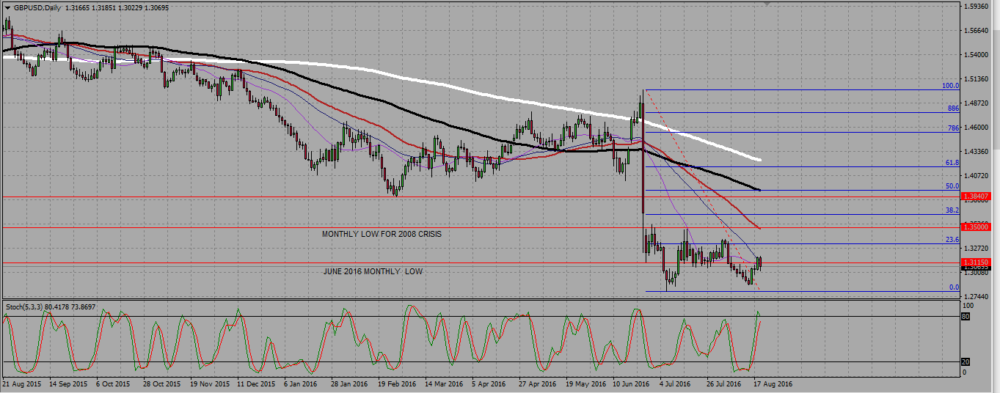
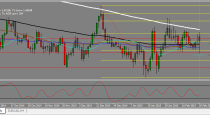
The daily chart looks like a failed retest at the low of June 2016. The pair broke it up on Thursday, to break it back down on Friday with a dark cloud cover pattern. Here again, it is not still a valid reversal figure, and ss the cable is very low, you do not want to rush to sell it: we need to wait patiently for a good setup, near or under 1,315. But in case this resistance around 1,315 is broken up strongly, GBPUSD will probably go and retest the low of the 2008 crisis around 1,35.
GBPUSD DAILY CHART.

 (1 votes, average: 4.00 out of 5)
Add your review