1,45 – 1,438 is a no trading zone. Sell break down of 1,4375 and more generally under 1,438 sell signals towards 1,405. Above 1,45, rather buy signals. Remember that the cable may be affected by fundamental (Brexit) factors, so be cautious when trading that pair.
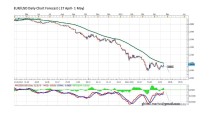
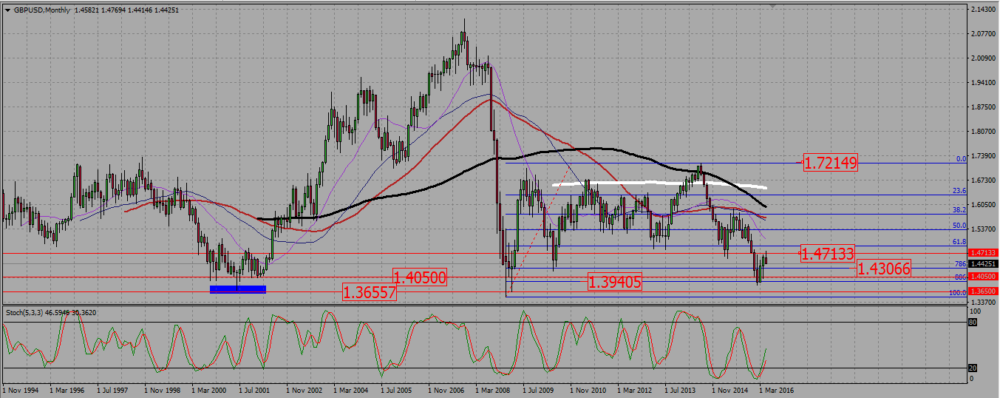
On the monthly chart the pair seems rather bearish : the SMAs are rather pointing down, and since the pair reached a high around 1,72 in July 2014, it starts to make lower highs and lower lows. The cable found some support around 1,39, and jumped back a little bit, but now it seems to reject a resistance near 1,47.
GBPUSD MONTHLY CHART.
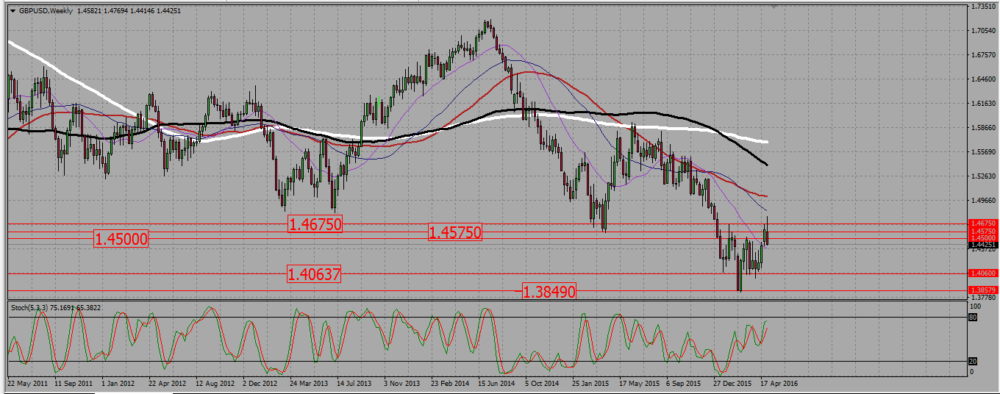
The weekly chart is very bearish. Not only do we see the SMAs pointing down, but the last candle is something between a shooting star and a bearish engulfing candle. The cable broke a support near 1,45, that we may now use as a resistance. Please take note of the 1,405 level, as it seems to be a strong support, and a logical take profit level for any short trade.
GBPUSD WEEKLY CHART.
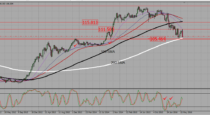
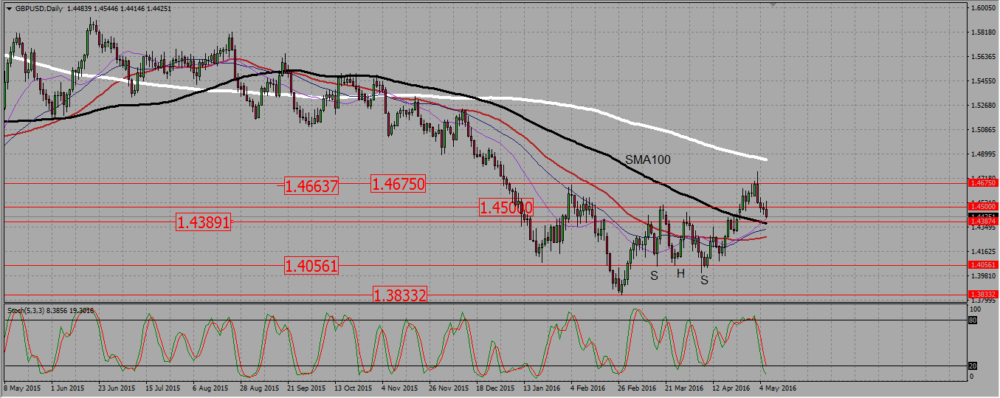
On the daily chart, it is not that bearish anymore. First we see that short terms SMAs are pointing up, but that may be just the bullish consolidation of a bearish trend. More significantly, the pair tried to make an inverted head and shoulder, and we have a support line around 1,438 -1,4375. The pair is just going to retest it, with the 100 SMA also coming at that level. We cannot sell a pair above such a support, and this is why 1,45, – 1,4375 must be considered as a non trading zone. But should we break down 1,4375, there is a good chance the cable will fall all the way down to 1,405.
GBPUSD DAILY CHART.
 (1 votes, average: 5.00 out of 5)