
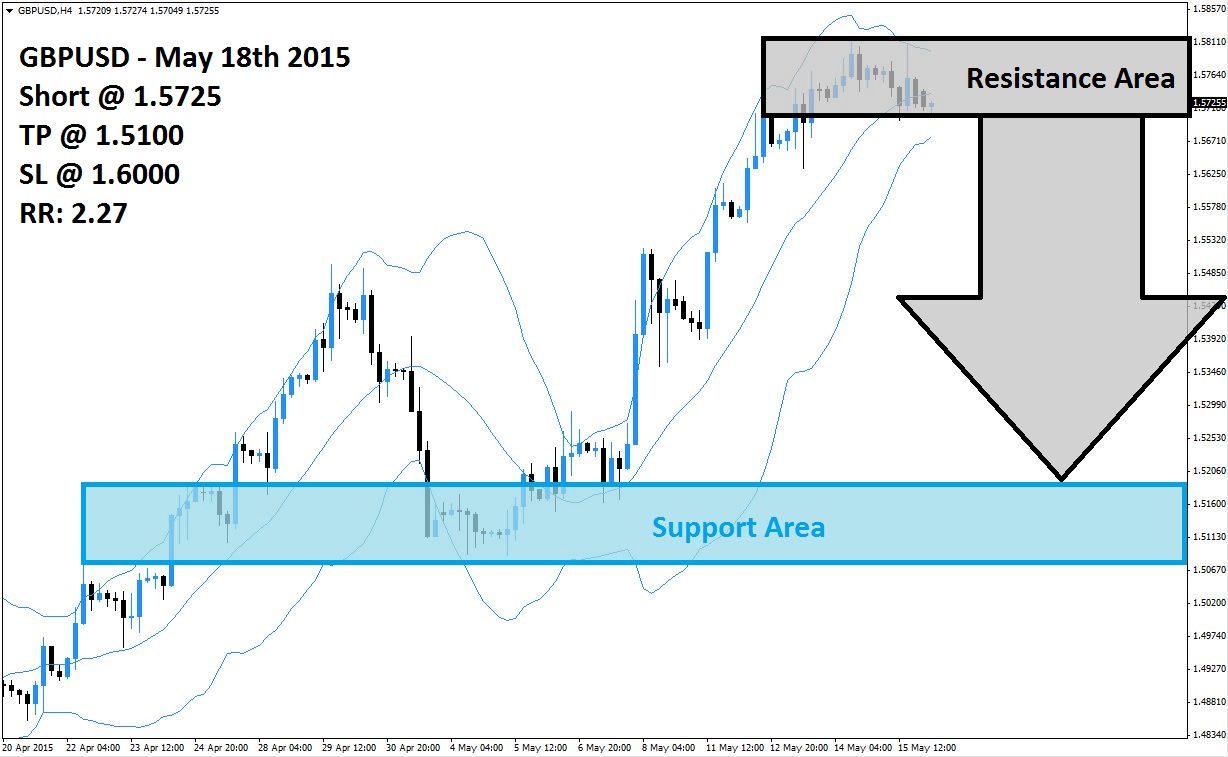
The GBPUSD has started to reverse its strong rally as it failed to breakout above its resistance area which is visible in light grey in the above H4 chart. New fundamental data has resulted in a decrease in buying pressure and forex traders may opt to take this as a reason to realize floating trading profits and exit long positions. A breakdown below its resistance area is expected to replace long positions with short positions which will increase the magnitude of the sell-off.
The upper band of the Bollinger Band indicator has started to slope downwards which is increasing pressures for a breakdown. Price action is now concentrated between the middle band and the lower band of its Bollinger Band indicator and a breakdown below the lower band , located just below its resistance area, is expected to result in an increase in selling pressure which can take the GBPUSD to its support area which is visible in light blue in the above chart.
Forex traders are advised to position their trading portfolios with short entries above 1.5725 in order to take advantage of the expected breakdown below resistance. The upper band of its Bollinger Band indicator is increasing downward pressure on the GBPUSD. More conservative forex traders may want to wait for a breakdown below the lower Bollinger Band before entering their short positions. A take profit target of 1.5100 has been selected for a potential profit of 625 pips.
Forex traders should protect this trade with a stop loss level at 1.6000 for a potential trading loss of 275 pips which will result in a Risk-Reward (RR) ratio of 2.27.
GBPUSD
Short @ 1.5725
TP @ 1.5100
SL @ 1.6000
RR: 2.27
 (No Ratings Yet)

Add your review