
The cable looks really bearish. Under 1,43, I will look for long terms selling signals.
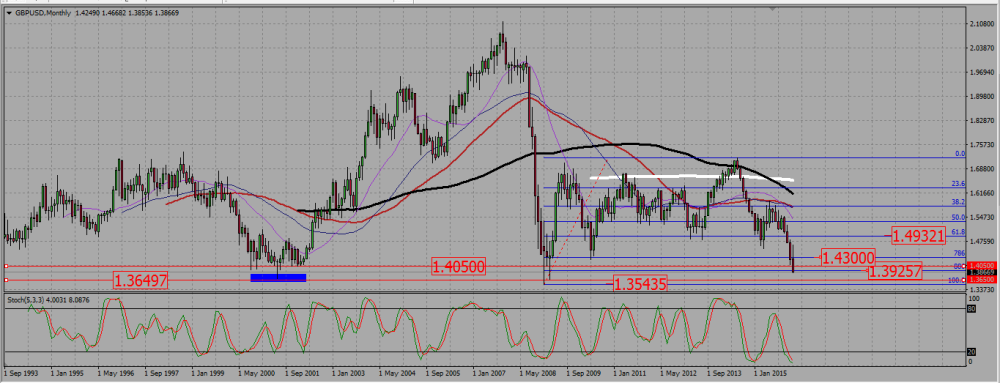
On the monthly chart, the SMAs are all pointing down. The cable broke down the 1,405 monthly support line, and ended the week around 1,39, where a 0,886 monthly Fibonacci level is located. The pair is mainly moved by fundamentals, that is fear -or hope- of a brexit, but we are at a critical technical level. If the cable keeps going down, it may be long term as we are entering levels not seen since quite a long time. I prefer to sell rallies into resistance as long as we are under the 0,786 Fibonacci level around 1,43. If the pound does not rally, I will sell confirmed break down of supports, such as the 1,365 or the 1,355. Here again, trade cautiously as we are very low: a bullish reversal is still possible above 1,355.
GBPUSD MONTHLY CHART.
The weekly chart shows a downtrend. SMAs are pointing down, the pair is making lower highs and lower lows. The last candle is a very powerful bearish Marubozu, and I do not want to buy against such a bearish show of strength.
GBPUSD WEEKLY CHART.

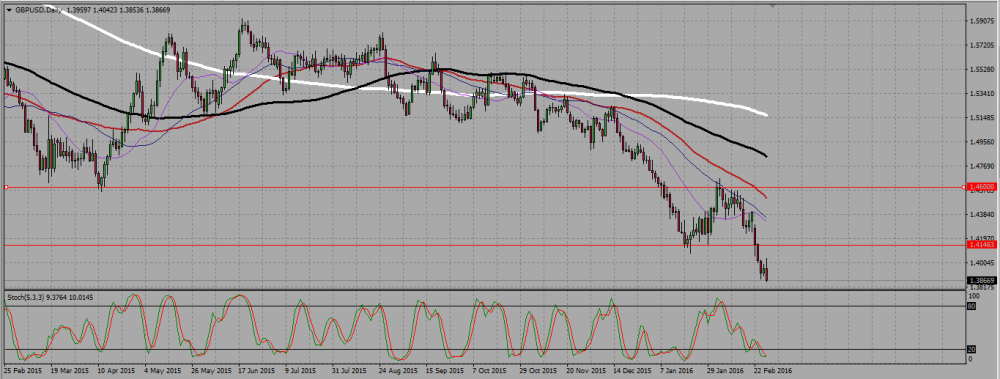
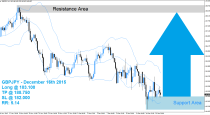
The daily chart is also strongly bearish: this is the kind of pair you want to sell. I prefer to wait for a rally to a resistance, then sell with a signal, but the configuration is now so bearish that I will also sell the confirmed breakdown of a support.
GBPUSD DAILY CHART.
 (No Ratings Yet)
Add your review