
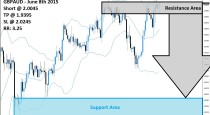
1- GBPUSD trading plan.
Buy signals above 1,515 towards 1,5325 and 1,586. Follow closely price action around 1,5325 for it is a strong resistance/support level and any break out or reversal there should be taken very seriously. If the pair breaks down 1,515, and as it is trading sideways, I will avoid taking short trades as long as we are above 1,49.
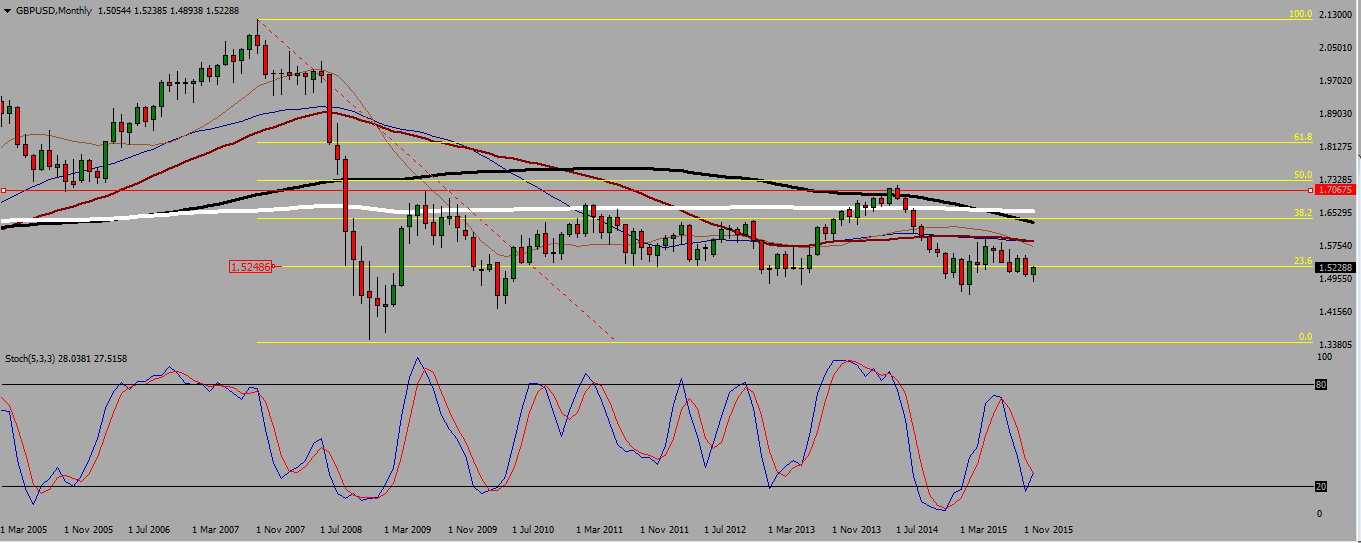
The monthly chart shows the cable in a side way mode. The pair is currently retesting a resistance it has previously broken down around 1,525, which is also a 23,6 Fibonacci level. Please keep in mind the 1,5325 level, which appears to be a relevant resistance.
GBPUSD MONTHLY CHART.
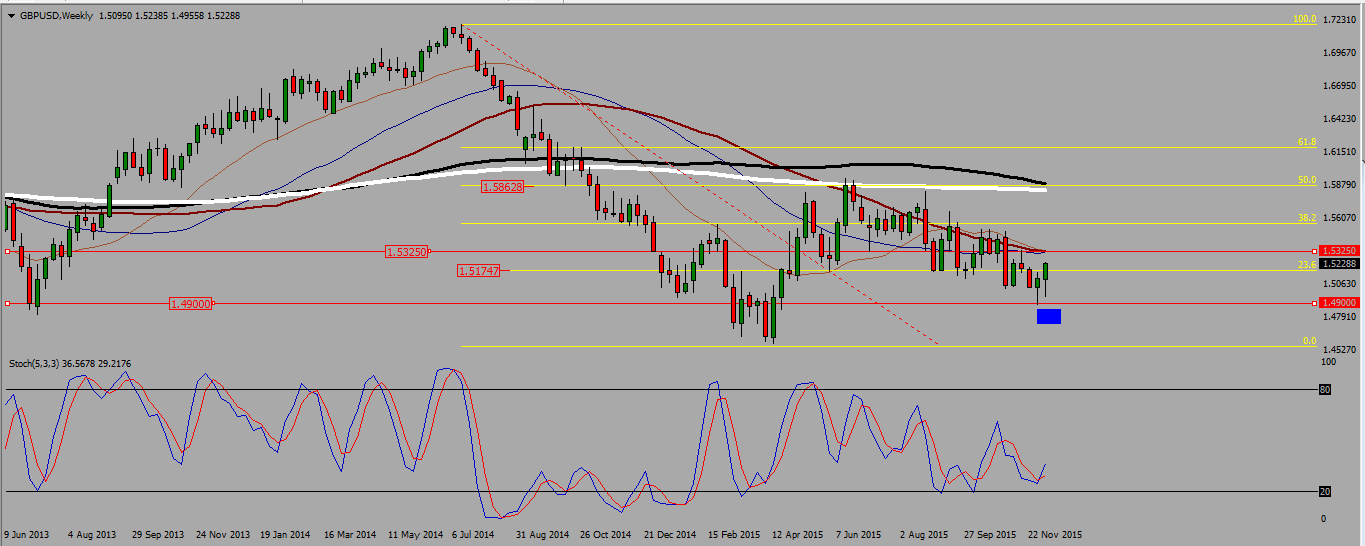
On the weekly chart, we see two hammers, with long down wicks, indicating a strong support level lurks around 1,49. The pair broke up a 23,6 Fibonacci resistance around 1,5175, which we may use as a support, and there are two other major resistance: one is the 1,5325, with the 20,40, and 55 SMAs located there, another is around 1,586, with a 50 Fibonacci level, and both the 100 and 200 SMAs. The 200 SMA is flat,meaning there is no trend on that pair.
GBPUSD WEEKLY CHART.
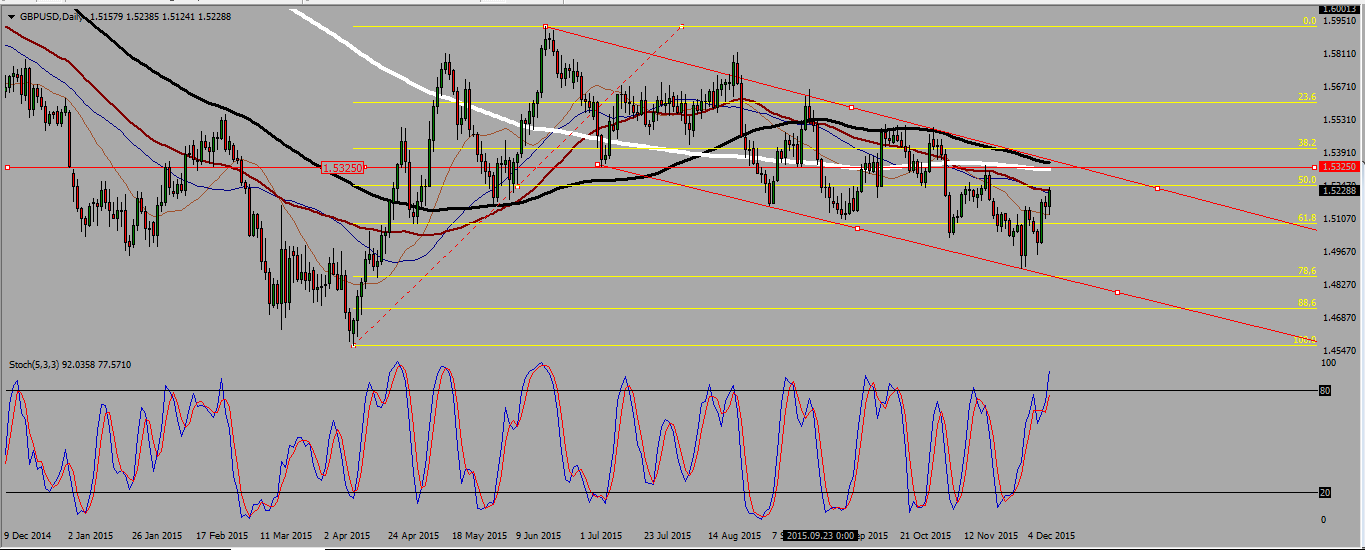
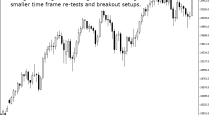
The daily chart shows the pair consolidating in an ugly flag. The flag resistance, where the 100 and 200 SMAs are also located, is around 1,5325, i.e. the same level we noticed on the weekly chart. This is why this resistance must be very closely monitored.
GBPUSD DAILY CHART.
2-USDJPY trading plan.
The pair is in an uptrend, facing a former monthly high around 123,5. Expect a bearish consolidation, may be down to 118,5. As the long term trend is bullish, I will wait for this consolidation to end, and I will buy pull backs on support as long as we remain above 118,5.
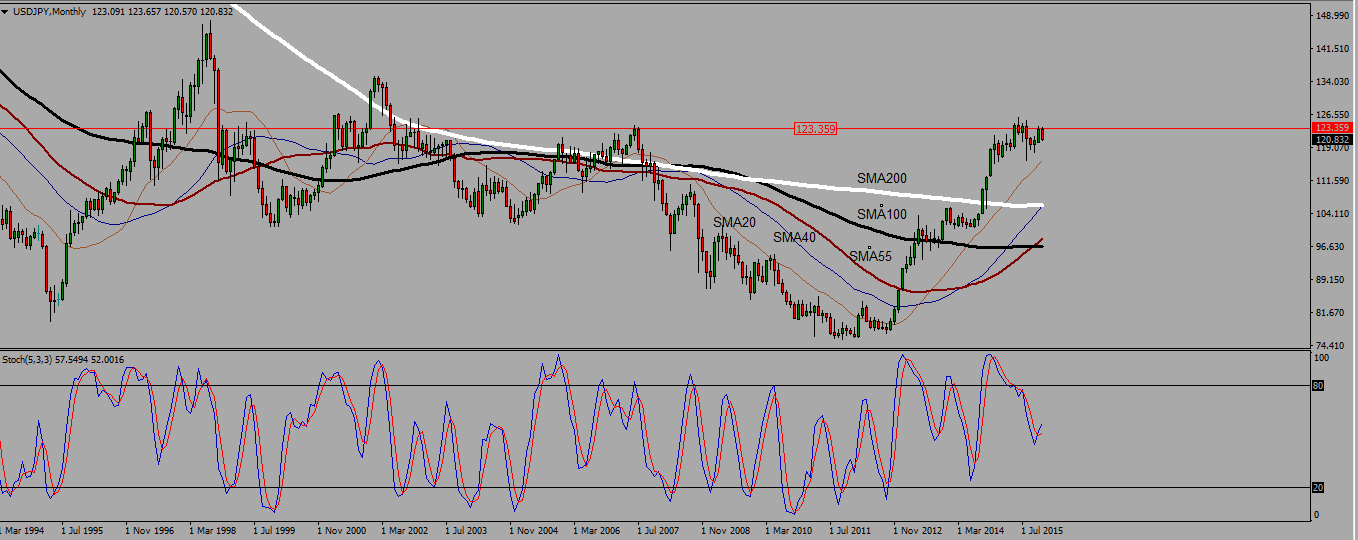
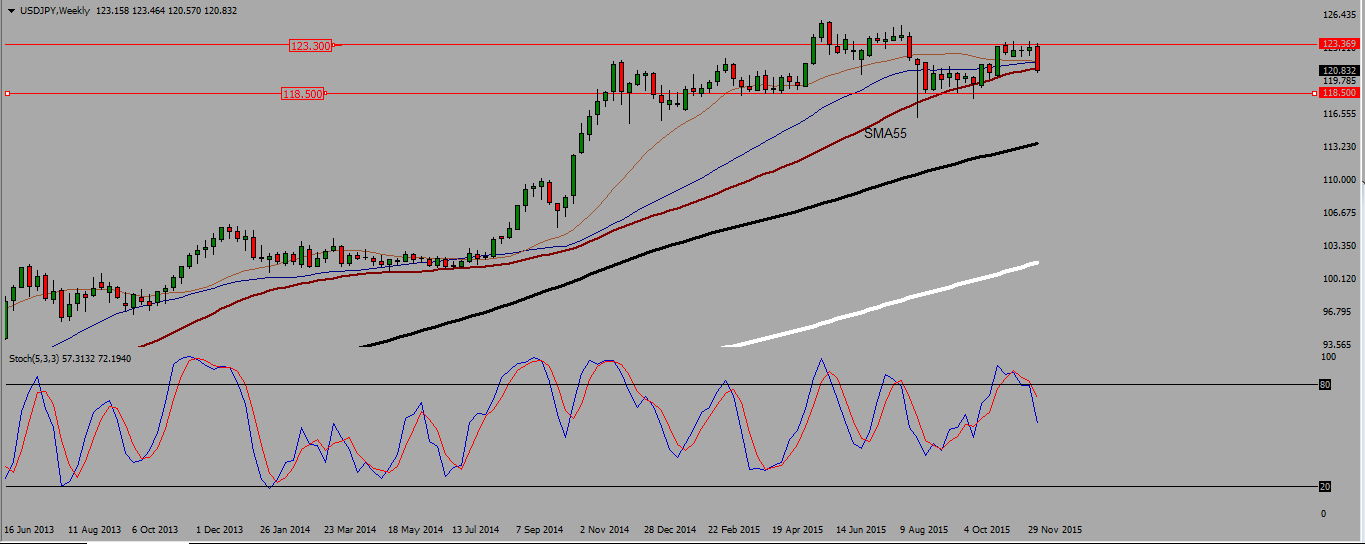
On the monthly chart, we see the pair retesting a former high around 123,5. All SMAs are slowly turning up, and positioning themselves in an uptrend configuration. The August candle was a powerful hanging man, since then the pair has been pretty much consolidating within that candle.
USDJPY MONTHLY CHART.
The last weekly candle is a powerful bearish engulfing one, rejecting a resistance around 123,25. The SMas are all pointing up, which indicates an uptrend, but I would not go against the strength of that candle.
The pair is resting above the 55 SMA, which looks like a strong support around 120,8, and the next support we see on that graph is an horizontal line around 118,5. As long as the pair remains above that level, I prefer to buy pull back because the long term trend is still up, but I am expecting a pull back first.
USDJPY WEEKLY CHART.
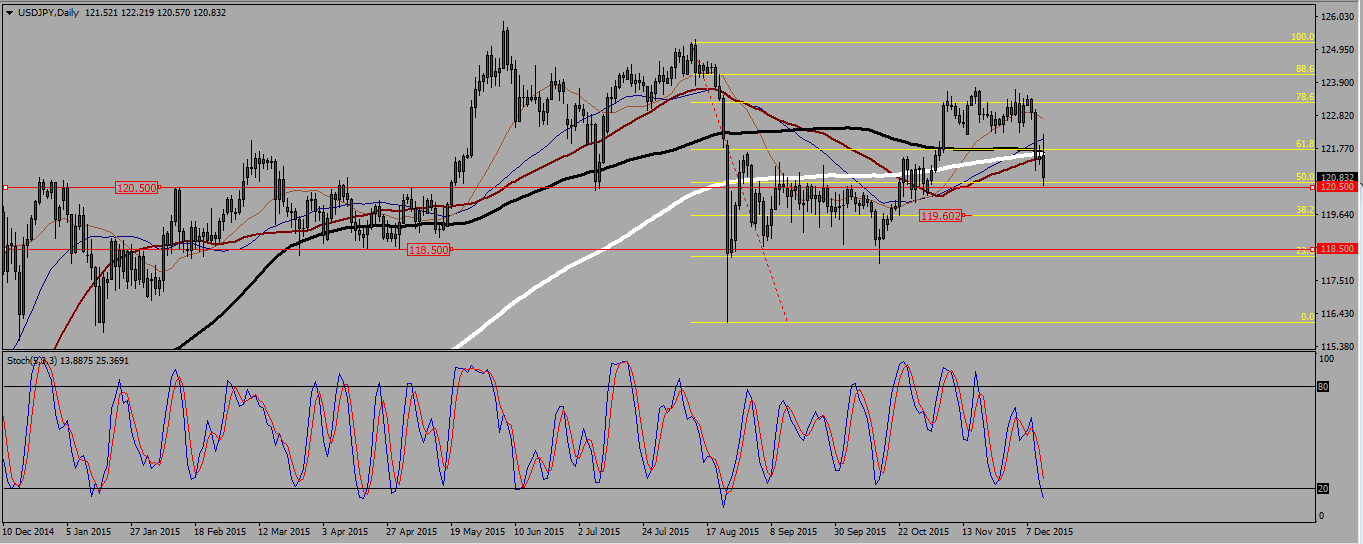
The daily chart finally reveals why the USDJPY could not go higher. It reversed on a 0,786 Fibonacci resistance level at 123,3 and is now resting on the 50 level support, at 120,5. If it break it down, the next levels are around 119,5, with yhe 38,2 Fibonacci level, and then around 118,5 with the 23,6 Fibonacci support level. Those are the levels I will watch for buying signals.
USDJPY DAILY CHART.
 (1 votes, average: 5.00 out of 5)
Add your review