
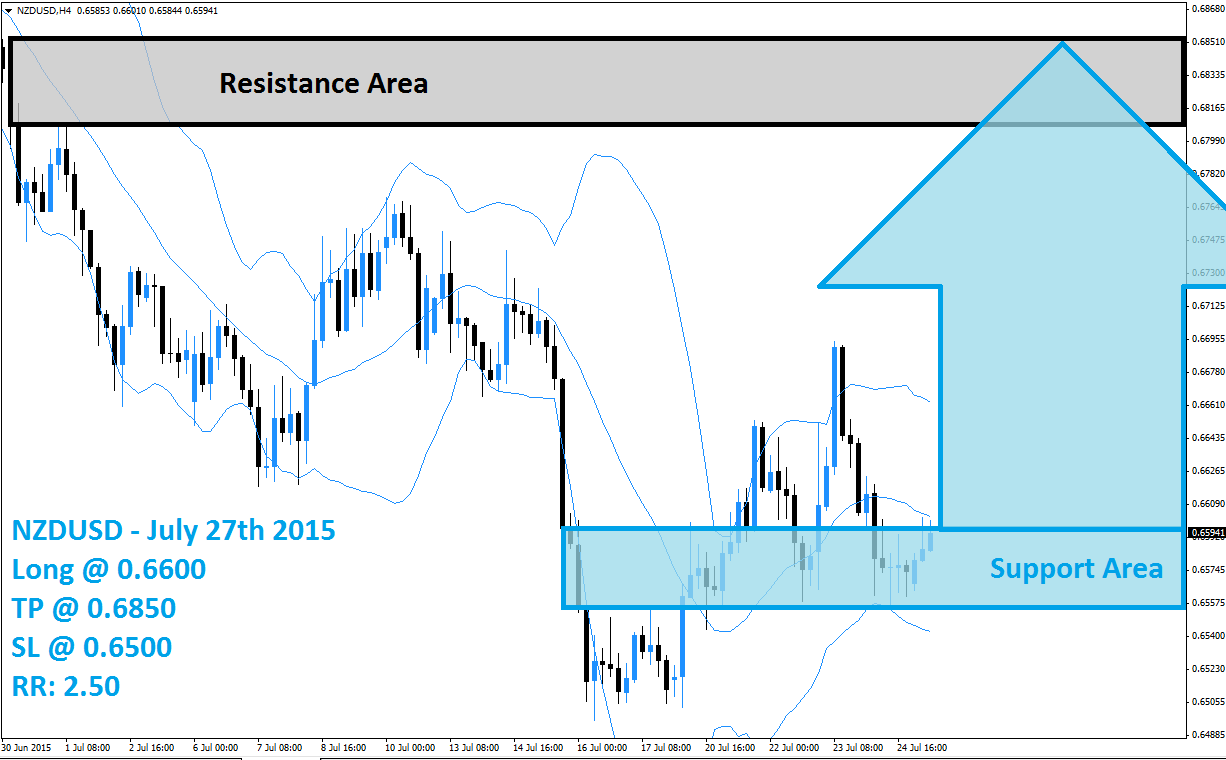
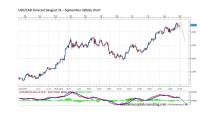
The NZDUSD has recovered from a false breakdown below its support area which is marked in light blue in the above H4 chart. The initial rebound took this currency pair above its support area and above the upper band of its Bollinger Band Indicator. The NZDUSD has since dropped back into its support area and is now trading between the middle band and the lower band of its Bollinger Band indicator. The lower band is trading below the support area while the middle band is trading above it.
The Bollinger Band Indicator is sloping to the downside, but forex trader may decide to realize floating trading profits and exit their short positons. This will lead to a short-covering rally and if the current high from its initial price action reversal will be invalidated by a higher high, the GBPUSD is set to continue its expected rally. A breakout above the middle band as well as the upper band of its Bollinger Band indicator is also expected.
Forex traders are recommended to position themselves with long entry positions at 0.6600 and below in order to take advantage of the expected short-covering rally. Conservative forex traders are recommended to wait for breakout above its middle Bollinger Band before entering their long positions. A take profit target of 0.6850 has been set for a potential trading profit of 250 pips on the H4 Chart. More buy orders are expected after the GBPUSD break outs above its middle Bollinger Band.
Forex traders should protect this trade with a stop loss level at 0.6500 for a potential trading loss of 100 pips which will result in a Risk-Reward (RR) ratio of 2.50.
NZDUSD
Long @ 0.6600
TP @ 0.6850
SL @ 0.6500
RR: 2.50
 (No Ratings Yet)
Add your review